
Sheep Nocturnal Activity Dataset


1
Instituto Politécnico de Viseu, CERNAS—Centro de Recursos Naturais, Ambiente e Sociedade, Escola Superior Agrária, Quinta da Alagoa-Estrada de Nelas, 3500-606 Viseu, Portugal
2
Instituto de Telecomunicações and Escola Superior de Tecnologia e Gestão de Águeda, Universidade de Aveiro, 3830-193 Aveiro, Portugal
3
Instituto Nacional de Investigação Agrária e Veterinária I.P. (INIAV), Avenida Professor Vaz Portugal, 2005-424 Vale de Santarém, Portugal
4
Instituto Federal Catarinense–Campus Araquari, Araquari 89245-000, Brazil
*
Author to whom correspondence should be addressed.
Data 2022, 7(9), 134; https://doi.org/10.3390/data7090134
Submission received: 19 July 2022
/
Revised: 26 August 2022
/
Accepted: 8 September 2022
/
Published: 14 September 2022
(This article belongs to the Section Information Systems and Data Management)
Abstract
:Monitoring sheep’s behavior is of paramount importance, because deviations from normal patterns may indicate nutritional, thermal or social stress, changes in reproductive status, health issues, or predator attacks. The night period, despite being a more restful period in which animals are theoretically sleeping and resting, represents approximately half of the life cycle of animals; therefore, its study is of immense interest. Wearable sensors have become a widely recognized technique for monitoring activity, both for their precision and the ease with which the sensorized data can be analyzed. The present dataset consists of data from the sensorization of 18 Serra da Estrela sheep, during the nocturnal period between 18 November 2021 and 16 February 2022. The data contain measurements taken by ultrasound and accelerometry of the height from neck to ground, as well as measurements taken by an accelerometer in the monitoring collar. Data were collected every 10 s when the animals were in the shelter. With the collection of data from various sensors, active and inactive periods can be identified throughout the night, quantifying the number and average time of those periods.
Dataset License: CC BY 4.0.
1. Introduction
Ewes typically compete for resources, such as feed distribution points, access to water, favorite resting places, and the freedom to move around [1]. Sheep have a regular and synchronous schedule of activity and resting [2], which can be used to indicate social stress/welfare. Acquiring data representative of those activities is important to identify deviant patterns that could be associated with feeding (e.g., eating and ruminating times [3,4,5], sleeping patterns [6], social interactions (e.g., dominance relationships [7], reproduction (e.g., rams’ mating activity [8], estrus [9] or lambing [10]), and health (e.g., lameness [11] or parasitic diseases [12]).
The monitoring of ruminant’s activity has been studied in the last ten years [13,14], through monitoring and human observation, through the combination of video surveillance methods and artificial intelligence techniques, and through the use of equipment with inertial sensors, such as accelerometers and gyros [15].
These works of monitoring and studying animal activity, despite being extensive and profound, have been focused on the daytime period, which is important because it allows the study of social behavior [16], intake [17], analysis of food preferences, but do not account for sheep’s nocturnal activity, which represents half of the animal cycle and consequently, has an enormous financial impact and affects the efficiency of livestock activity.
The literature related to animal behavior at night is scarce, and its analysis allows us to find mostly works across a few decades [18] carried out through human visual observation, in which the falling asleep and waking up cycles are described [18] and the energy expenditure is defined in the sleep and drowsiness periods [19], but without statistically specifying in detail the periods of sleep [20], sleepiness, or the usual activity linked with the animals‘ nocturnal behavior. Some studies focused on the changes to the nocturnal behavior of animals due to diseases such as anemia [21], acute hypoxia [22], and Huntington’s disease [23] during the kidding process, and therefore cannot be representative of sheep’s behavior during the sleep period.
The present work describes a dataset of sheep activity monitoring data that was created using a collar equipped with inertial sensors and by measuring the height of the neck to the ground through ultrasounds. The monitoring that enabled the creation of this dataset was carried out mostly at night, when the animals were stabled. The description of the dataset structure and the statistical characterization of the collected data can be found in Section 2, and Section 3 describes the capture and pre-processing procedures to which the data were subjected. Section 4 includes information on the video records created by an infrared video surveillance camera that allowed the flock’s behavior to be recorded in an image, thus being able to confirm behaviors and help in the interpretation of telemetric data. In Section 5, some brief conclusions about the paper and the dataset are drawn.
2. Data Gathering Methods
The sheep monitoring experience started on 18 November 2021 at the Viseu Agrarian School1 and lasted until 16 February 2022. The collars were attached to the same sheep throughout the period, removed to charge the batteries, and returned recharged to the same animal. Table A1 summarizes the number of monitoring days and daily monitoring file size, in addition to the extension of the monitoring experience.
The daily management of the animals remained unchanged during the experiment, as they continued to go to the pasture during the day, in addition to they continue to shelter in the same sheepfold during the nighttime period. The sheep were milked twice a day approximately at 8am and 6pm, and they were provided with fresh water and hay ad libitum. Between milking operations, they were left out to pasture and at night, they returned to take shelter in the sheepfold.
Data were captured over four weeks using iFarmTec [24] collars on 18 Serra da Estrela sheep, covering the animals’ sleeping period. Collars were integrated into the monitoring platform, as illustrated in Figure 1, periodically communicating with a gateway [25] that gathered the sensed data. The collars included a magnetometer, an accelerometer, and an ultrasound sensor to measure distance from the neck to the ground [26] and were parameterized to collect data at 10 s intervals and send them to the infrastructure.
The monitoring platform included a gateway and a relaying beacon placed inside the sheepfold, so animal collar communications were received when they were in the sheepfold. Since the purpose of the study was to monitor behavior during the rest period, the wireless sensor network infrastructure deployed did not cover the pasture area.
A video surveillance camera was placed in the sheepfold on a higher plan to video record the animals’ activity at night. It was equipped with a memory card, where the video files were stored and it was parameterized to start the recording at 18:00 h and end in the morning at 9:00, and thus collect the images of the animals during the period.
Figure 2 shows the same area of the sheepfold from another angle, through a photo taken during the day, to give an idea of the animals’ resting space.
3. Data Description
3.1. Dataset Summary
The original dataset contains 1,937,630 records collected during the interval between November 2021 and February 2022. Section 3.2 shows the various steps to verify and organize the original data, containing the data’s transformation and adjustment. The data distribution in terms of status and year attributes is presented in Figure 3 and it demonstrates a similar distribution between the records gathered in 2021 and 2022. The status of the animal when the collar record is produced is stored in the attribute named “S”, using the classification algorithm developed in [22]. It can be observed that the classification accuracy certainly has a limited value, since the associated machine learning process was carried out in a pasture scenario and the differences surely should have a deep impact on algorithm performance. The possible values are as follows:
- “S”—Standing,
- “E”—Eating,
- “M”—Moving,
- “R”—Running
- “X”—Undetermined.
Figure 3.
Records classification by status/year.

The final dataset, as described in Table 1, has 1,685,974 records ordered by index columns (timestamp and ID).
ID represents the identification of the animal; the timestamp stores the instant of the record produced by the collar. Year, month, day, hour, minute, second, and wd are derived measures computed from the timestamp value.
The dist attribute represents the neck distance to the ground. The inclination angle to the horizontal plane is represented by the attribute pitch and the rotation angle by the attribute roll.
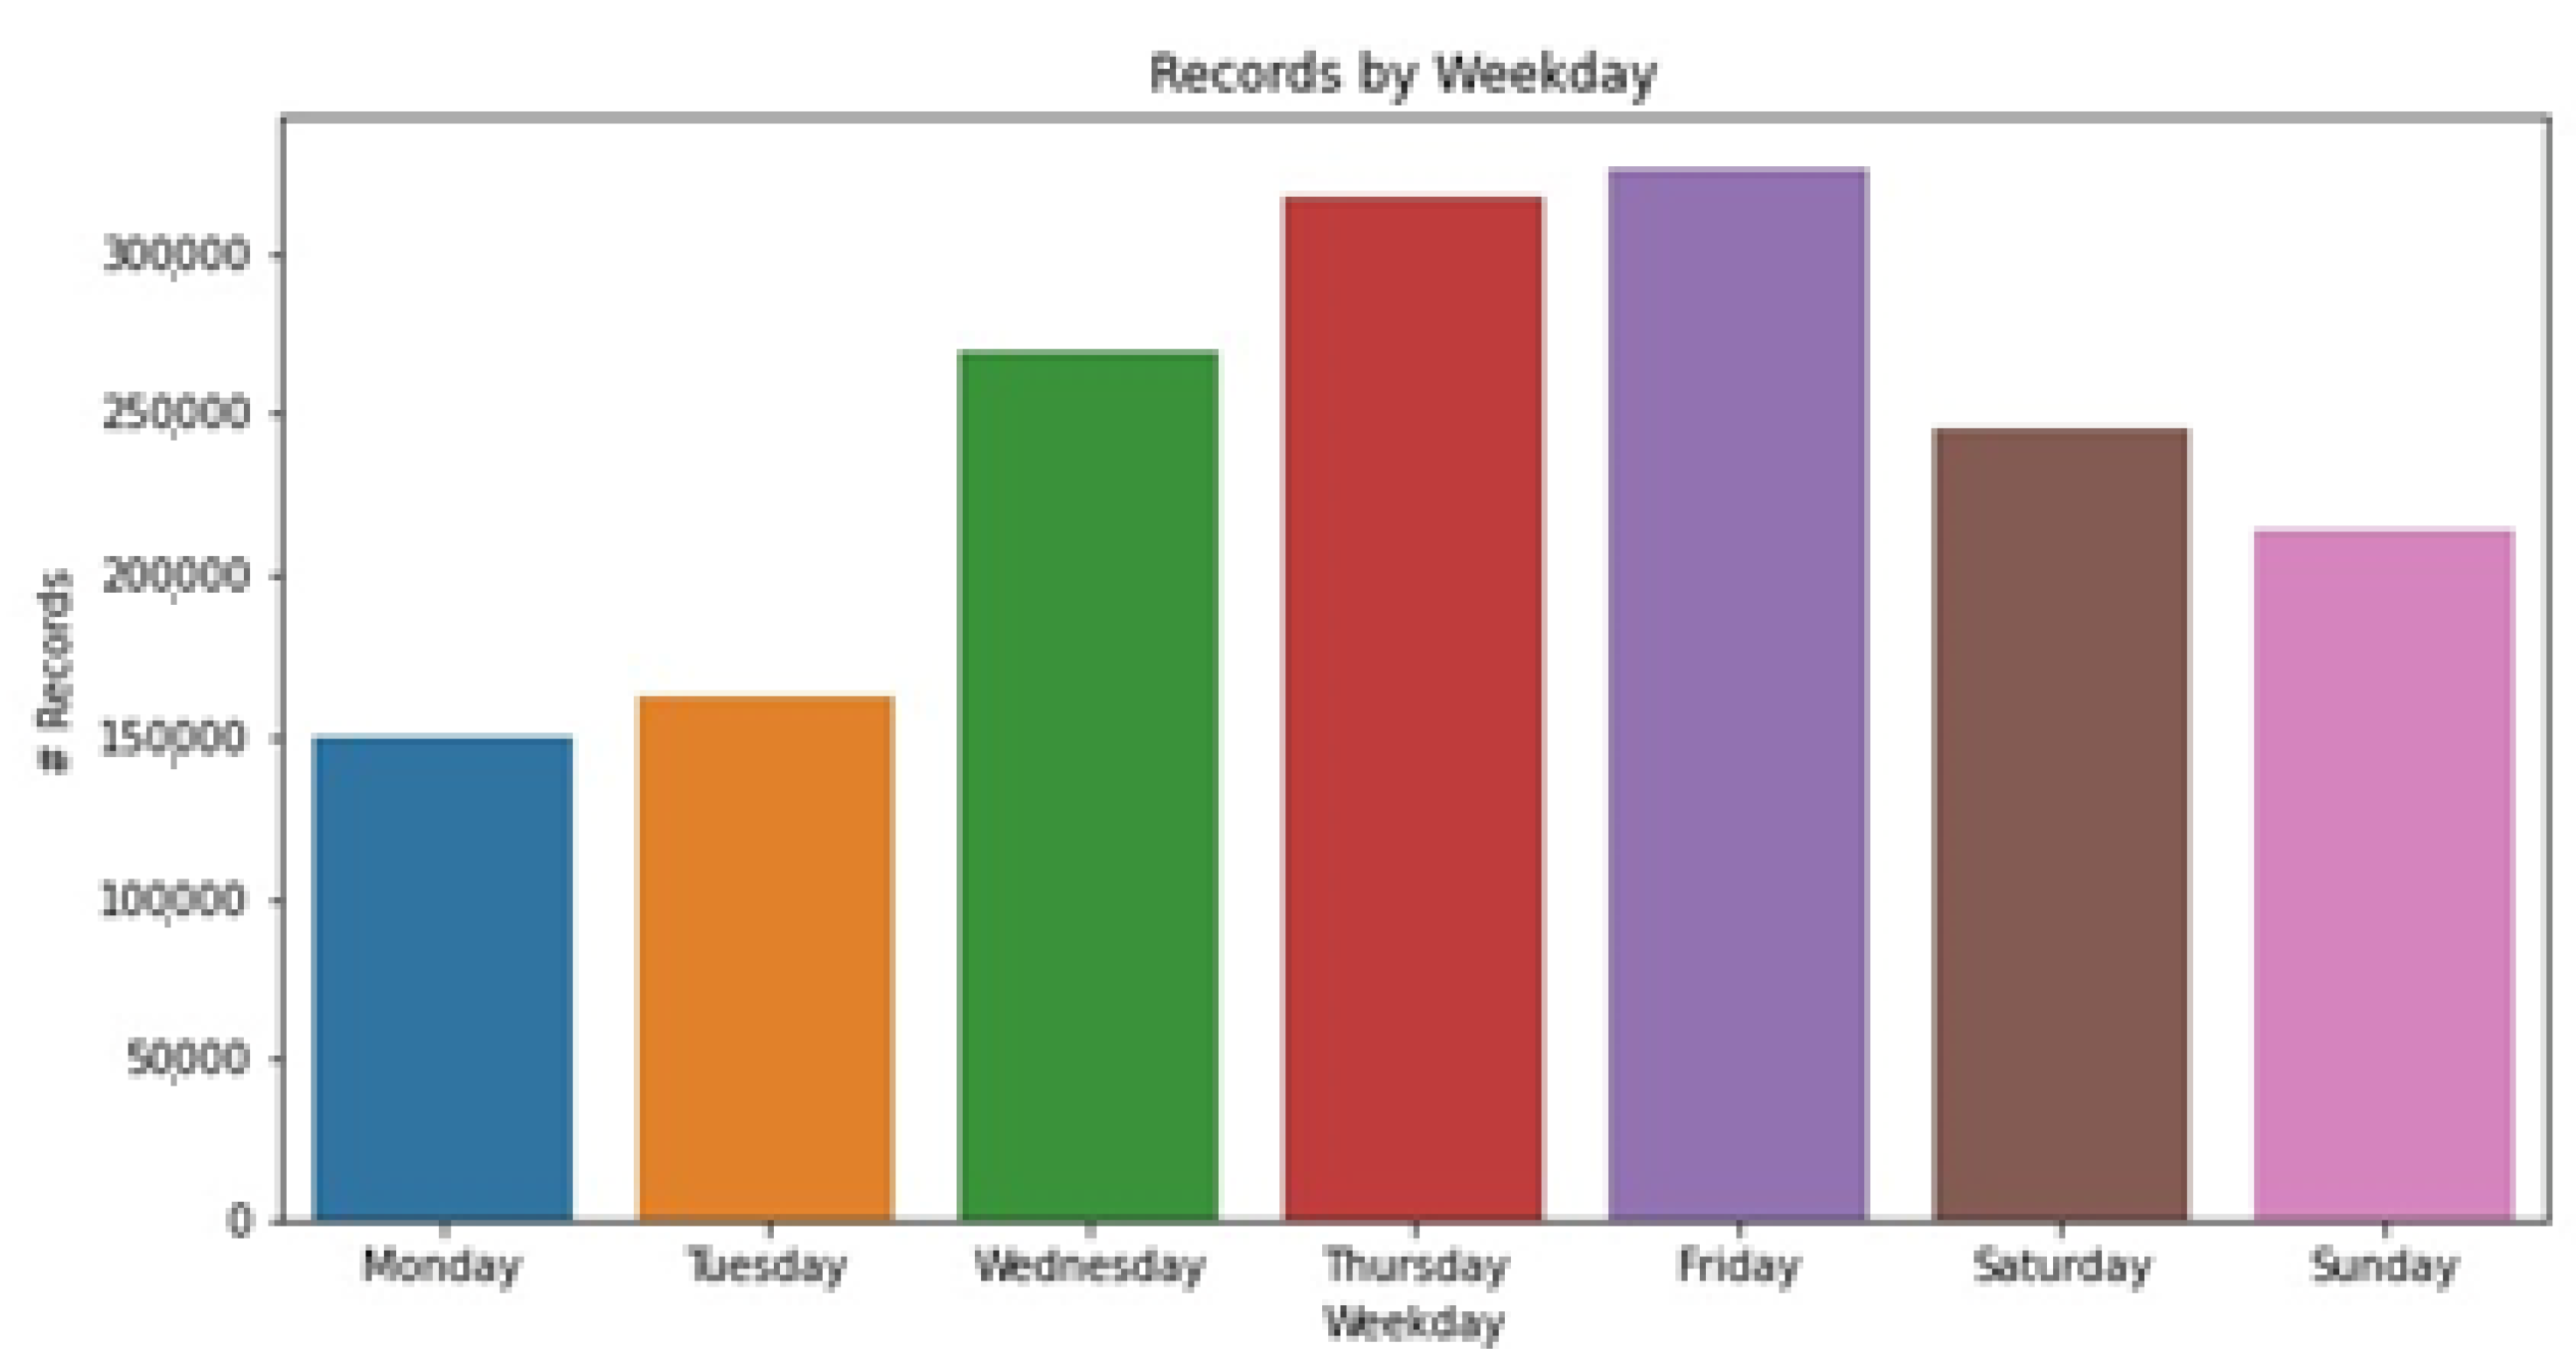
Figure 4 presents a weekly distribution of the records, where it is possible to observe a random variation in the amount of records, despite the collar communications being periodic and containing same period in all of them. This variation in the daily records gathered is due to two factors. The first involves the charging process of the collar batteries and the fact that battery charging was not always carried out the same day, nor were the collars always absent at the same time. Analysis of Figure 4, where the daily files created by the gateway are listed with the identification of their size, makes it possible to verify the irregularity of the previously described loading process. The second reason for the differences in the daily number of records involves the weekend management, in which the animals were not always taken to the meadow, which greatly increased the time spent in the sheepfold, and consequently increased the number of records.
Figure 5 illustrates the hourly distribution of records by status, and it allows us to understand the static nature of the animals’ nocturnal behavior, which is quite different from the animals’ behavior during the daytime intervals. Moreover, the record distributions confirm the previous assumption that animals do not leave the sheepfold every day in the morning, which is reason why diurnal communications from the collars were received and stored by the gateway.
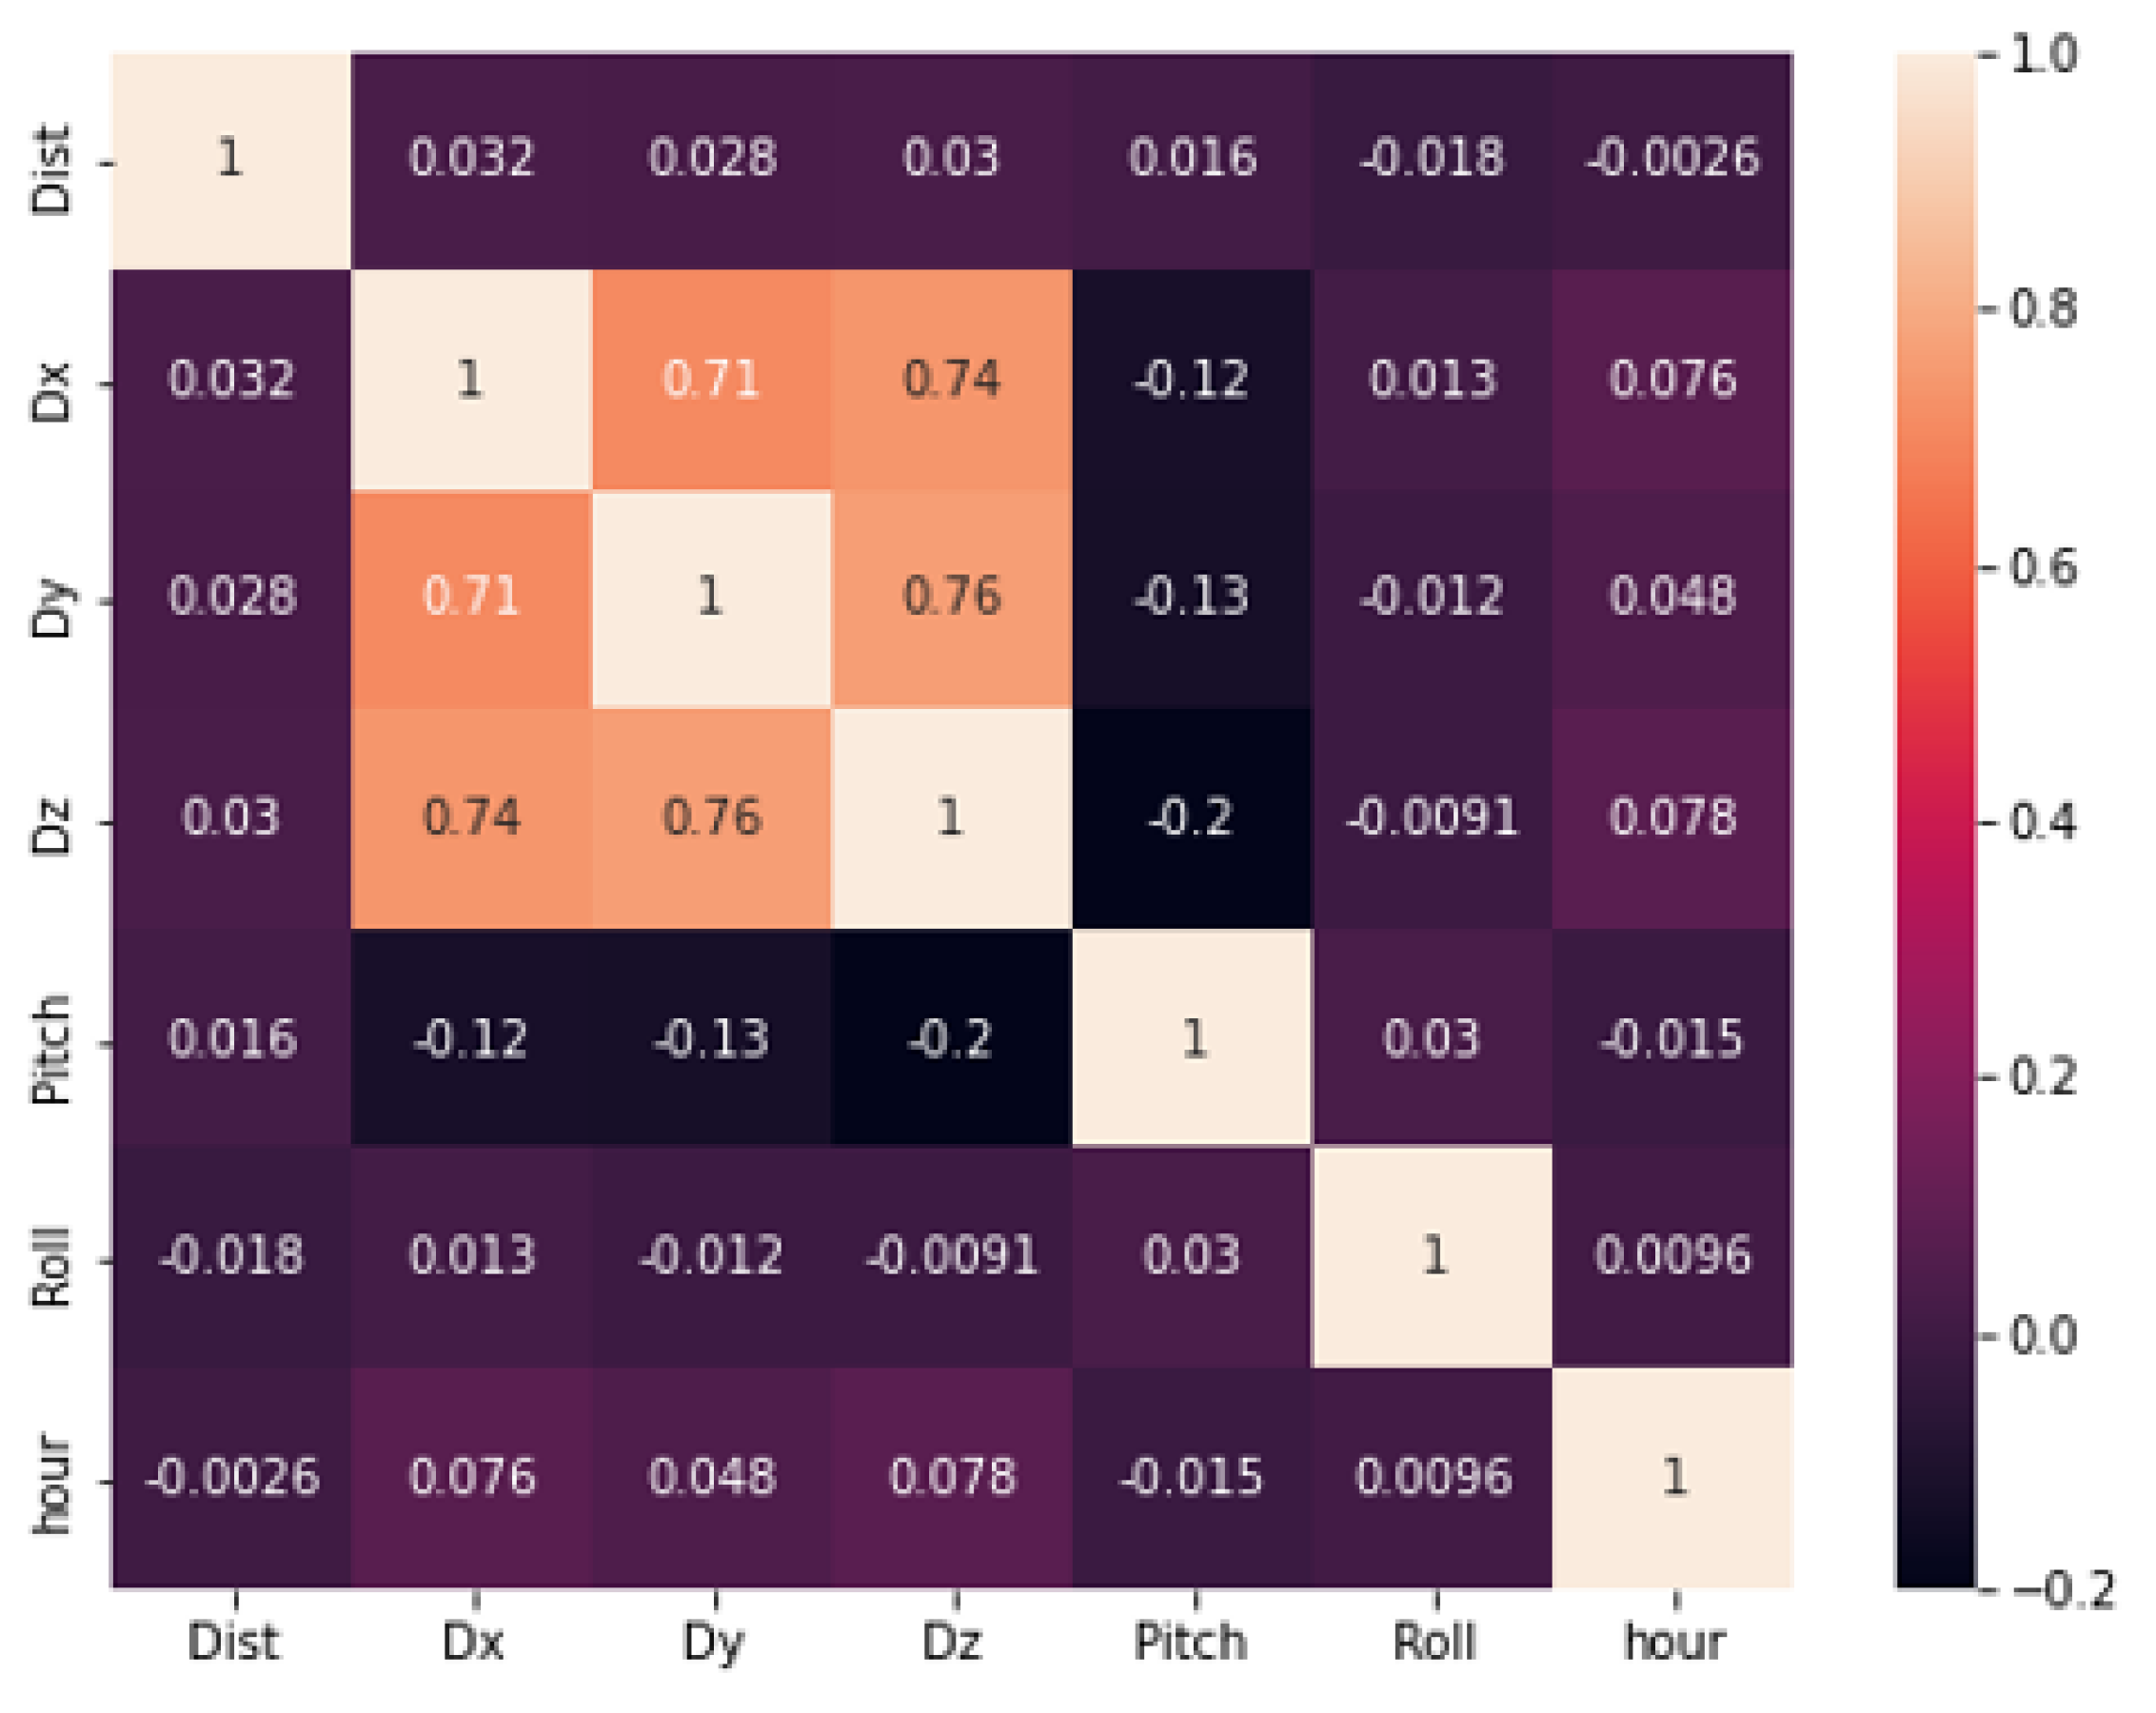
The attribute correlations can be found in Figure 6. These are coefficients that represent the strength of a linear association between two variables. A perfect linear relationship is characterized by an absolute value of 1, and values close to 0 indicate no linear relationship.
The quartiles of pitch and roll attributes can be found inFigure 7A,B. For each hour, values of the mean, std (standard deviation), Min (minimal), 25% (quartile 1), 50% (quartile 2), 75% (quartile 3), and max (maximal) related to the values of pitch and roll are presented.
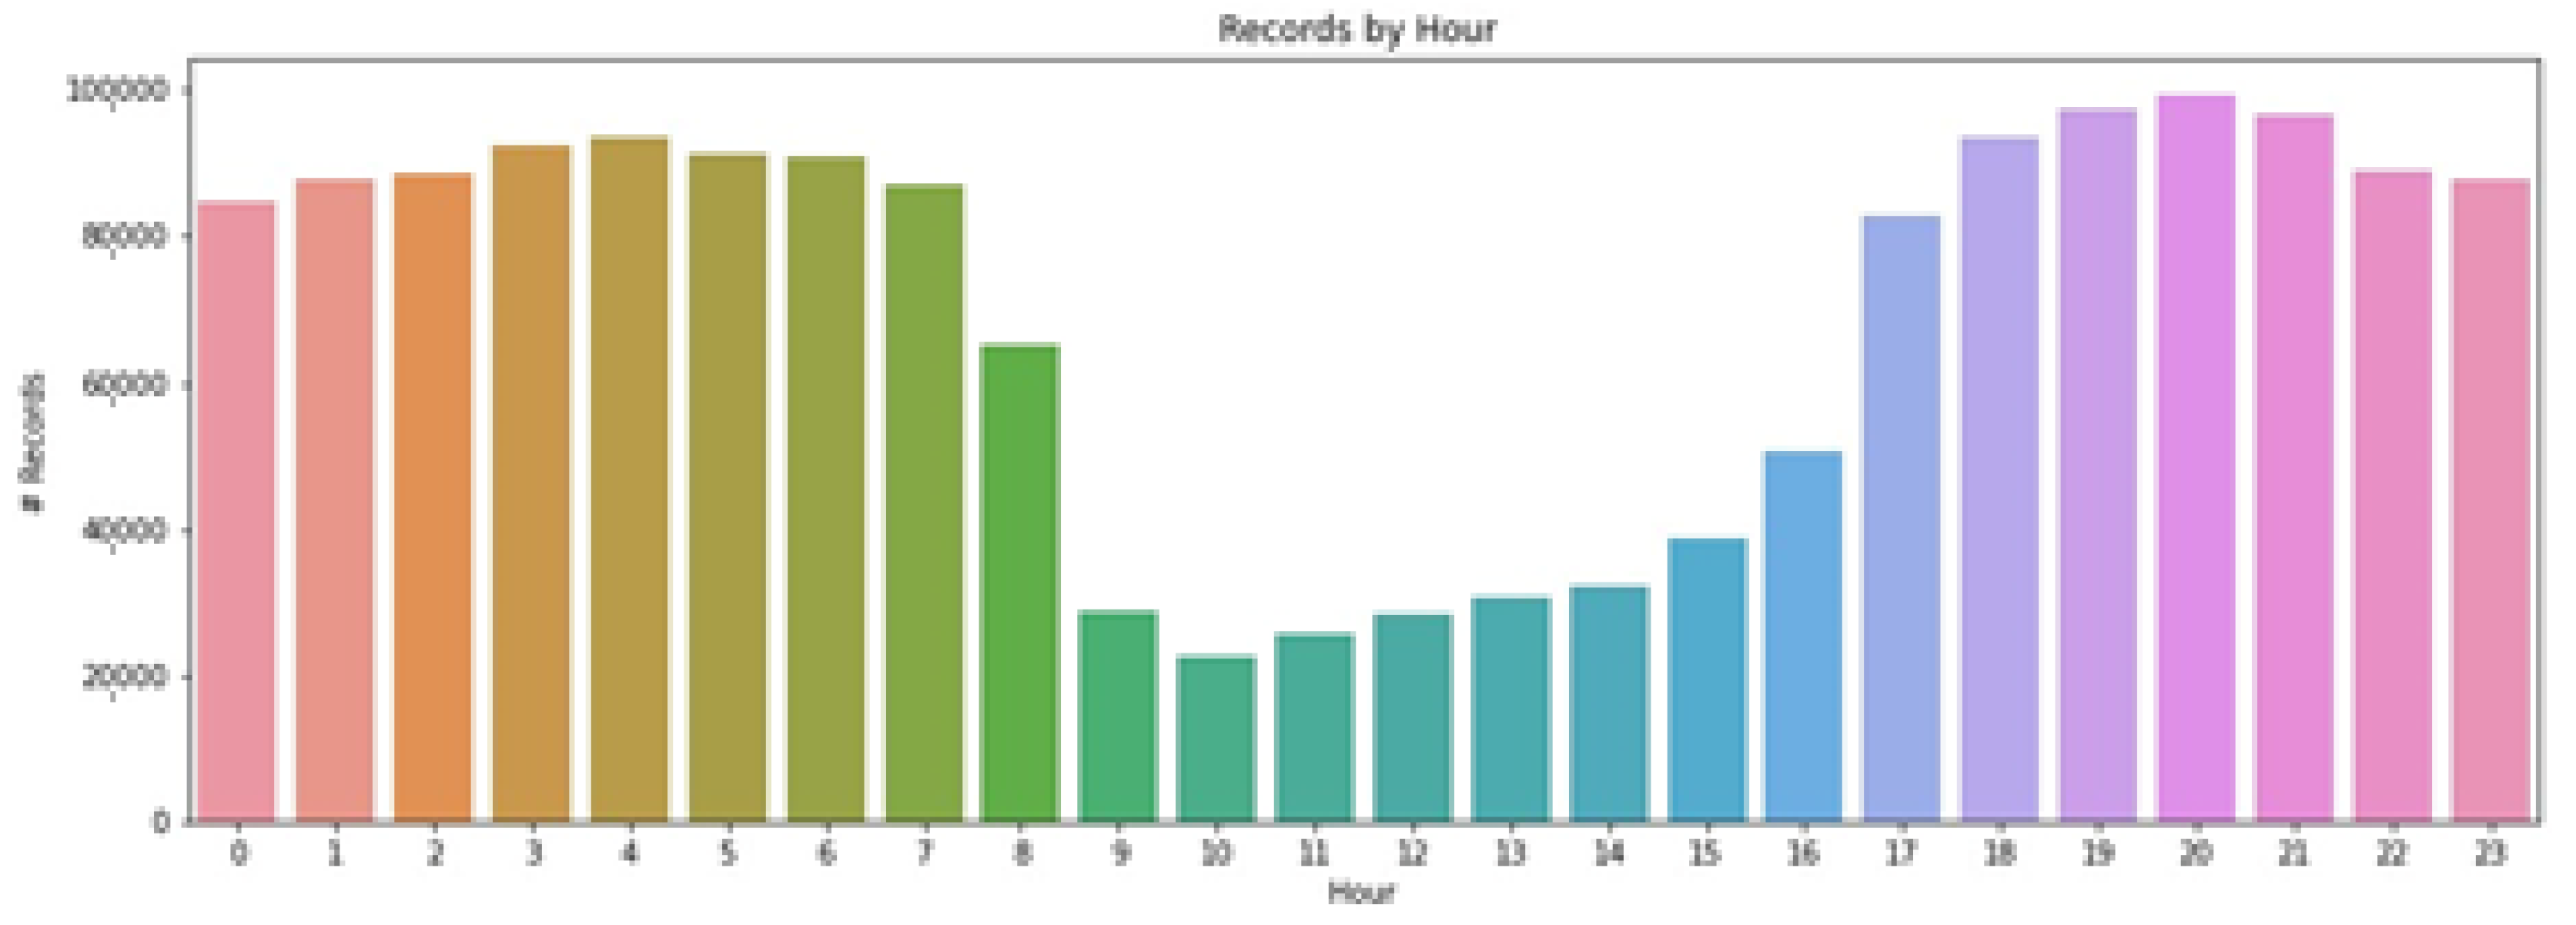
Finally, Figure 8 represents the daily distribution of the gathered records.
3.2. Dataset Preparation
Figure 9 shows the complete workflow designed to prepare the final dataset. The process contains the following three steps:
- (a)
- Concatenation: concatenation of data from daily files;
- (b)
- Duplicate removal: elimination of duplicates and removal of malformed records;
- (c)
- Additional attributes: adding attributes.
Figure 9.
Data processing procedures.

The data cleaning process consisted of eliminating malformed records and unrealistic distance values measured by the ultrasound sensor. In fact, the ultrasound sensor was the most error-prone of the sensors existing in the collar. It was applied to the neck of the animal (Figure 10), and it measured different distances depending on the movement. The origin of the error has to do with the fact that sheep assume different positions in which the sensor transducer is unable to obtain the echo of the signals, which leads to unrealistic distances being measured, and therefore forced the removal of the records. When they are lying down, they assume different postures quite often.
The original dataset is composed of daily files produced by a gateway that continuously stores gathered data from the collars that transmit sensor data every 10 s.
Therefore, the first step was to concatenate the files that gave rise to a unique data set (a). After that, duplicate records were removed (b). In the last step, the attributes that represented the year, month, day, hour, minute, second, and day of the week were compiled (c).
4. Video Records
In addition to electronically monitoring the animals through the collars, video surveillance of the sheep was performed, and the video was recorded for future analysis. The videos are available, together with the dataset produced by the collars, and available for confirmation of animal behavior and activity.
The surveillance camera (HIKVISION DS-2CD2323G0-I) was placed in the sheepfold in a higher position to cover the space where the animals stayed (Figure 11). It was programmed to automatically start and stop the video recording of images to cover the period between the animals’ collection at the end of the day and their departure to the pasture with a 640 × 360 image encoded with ITU H.624 codec, with one frame per second.
The video camera collected daily images between 18:00 and 9:00 from 12 to 26 January 2022. The films that contained telemetry data were used. The 6-day recordings produced 90 h of footage, and are available for download at the URL where the dataset was published.
5. Conclusions
Monitoring animal activity is of importance for livestock management and is likely to have a significant impact on animal feed management. The nocturnal period represents a large part of animals’ life cycle, and its study is of significant importance.
The present paper describes a dataset based on data gathered by iFarmTec collars, applied to 18 sheep within the sheepfold, mainly during the night. The tests were carried out from 18 November 2021 to 16 February 2022 at Agrarian School of Viseu, Portugal. The animals wore the collars 24/7, except for when they were removed for battery charging purposes. The data were collected by a gateway present at the sheepfold and were later subjected to a preparation process that included the concatenation of the daily files, record duplicates and malformed records removal, and the insertion of additional attributes.
The final dataset included 1,937,630 records, covering mainly the nocturnal period, and it was enriched by video surveillance images taken by a night vision video camera placed in the shelter to analyze animal behavior.
Author Contributions
Conceptualization, P.G., M.R.M., A.T.B. and A.M.; methodology P.G., M.R.M., A.T.B., A.M. and F.B.; software, F.B.; validation, P.G., M.R.M., A.T.B., A.M. and F.B.; formal analysis F.B.; investigation, P.G., M.R.M., A.T.B., A.M. and F.B.; resources, P.G., M.R.M. and A.T.B.; data curation, P.G. and F.B.; writing—original draft preparation, P.G., M.R.M., A.T.B., A.M. and F.B.; writing—review and editing, P.G., M.R.M., A.T.B., A.M. and F.B.; visualization, P.G., M.R.M., A.T.B., A.M. and F.B. All authors have read and agreed to the published version of the manuscript.
Funding
This research was funded by FCT—Foundation for Science and Technology, I.P., Portugal, within the scope of the project ref. UIDB/00681/2020.
Institutional Review Board Statement
Ethical review and approval were waived for this study due to the reason that the system does not interfere with animals.
Informed Consent Statement
Not applicable.
Data Availability Statement
https://figshare.com/articles/media/OneDrive_1_19-07-2022_zip/20339154, accessed on 19 July 2022.
Acknowledgments
This work was funded by national funds through the FCT—Foundation for Science and Technology, I.P., within the scope of the project ref. UIDB/00681/2020. Furthermore, we would like to thank the CERNAS Research Centre and the Polytechnic Institutes of Viseu for their support. The authors take the opportunity to thank José Pereira from iFramTec for the support in the maintenance of the collars, and to Rosa Rodrigues from Escola Superior Agrária do Instituto Politécnico de Viseu for her help with the battery charging process.
Conflicts of Interest
The authors declare no conflict of interest.
| 1 |
Appendix A

Table A1.
Daily recording file sizes.
| Data | File Size (Bytes) |
|---|---|
| Thursday, 18 November 2021 | 106,727 |
| Friday, 19 November 2021 | 5,550,915 |
| Saturday, 20 November 2021 | 6,466,969 |
| Monday, 22 November 2021 | 4,435,944 |
| Tuesday, 23 November 2021 | 14,341,225 |
| Wednesday, 24 November 2021 | 12,851,732 |
| Thursday, 25 November 2021 | 16,307,252 |
| Friday, 26 November 2021 | 9,954,537 |
| Monday, 29 November 2021 | 1,005,152 |
| Tuesday, 30 November 2021 | 3,856,876 |
| Wednesday, 1 December 2021 | 10,423,803 |
| Thursday, 2 December 2021 | 9,929,926 |
| Friday, 3 December 2021 | 10,006,526 |
| Saturday, 4 December 2021 | 10,349,638 |
| Sunday, 5 December 2021 | 10,006,659 |
| Tuesday, 7 December 2021 | 9,666,299 |
| Wednesday, 8 December 2021 | 10,489,222 |
| Thursday, 9 December 2021 | 9,762,892 |
| Friday, 10 December 2021 | 8,327,982 |
| Saturday, 11 December 2021 | 8,186,628 |
| Sunday, 12 December 2021 | 8,416,629 |
| Monday, 13 December 2021 | 4,639,088 |
| Tuesday, 18 January 2022 | 6,369,158 |
| Wednesday, 19 January 2022 | 9,123,648 |
| Thursday, 20 January 2022 | 9,065,911 |
| Friday, 21 January 2022 | 7,486,474 |
| Thursday, 27 January 2022 | 4,474,113 |
| Friday, 28 January 2022 | 9,977,190 |
| Saturday, 29 January 2022 | 7,774,051 |
| Sunday, 30 January 2022 | 8,792,249 |
| Monday, 31 January 2022 | 7,266,024 |
| Wednesday, 2 February 2022 | 5,466,426 |
| Thursday, 3 February 2022 | 10,550,258 |
| Friday, 4 February 2022 | 10,315,494 |
| Saturday, 5 February 2022 | 10,515,301 |
| Sunday, 6 February 2022 | 10,042,601 |
| Monday, 7 February 2022 | 5,037,658 |
| Wednesday, 9 February 2022 | 6,619,338 |
| Thursday, 10 February 2022 | 10,880,426 |
| Friday, 11 February 2022 | 10,645,800 |
| Saturday, 12 February 2022 | 11,738,429 |
| Sunday, 13 February 2022 | 10,301,999 |
| Monday, 14 February 2022 | 4,869,313 |
| Tuesday, 15 February 2022 | 7,799,616 |
| Wednesday, 16 February 2022 | 4,687,573 |
References
- Bøe, K.E.; Berg, S.; Andersen, I.L. Resting Behaviour and Displacements in Ewes—Effects of Reduced Lying Space and Pen Shape. Appl. Anim. Behav. Sci. 2006, 98, 249–259. [Google Scholar] [CrossRef]
- Penning, P. Synchronization of eating, ruminating and idling activity by grazing sheep. Appl. Anim. Behav. Sci. 1991, 32. [Google Scholar]
- Molle, G.; Decandia, M.; Giovanetti, V.; Manca, C.; Acciaro, M.; Epifani, G.; Salis, L.; Cabiddu, A.; Sitzia, M.; Cannas, A. Grazing Behaviour, Intake and Performance of Dairy Ewes with Restricted Access Time to Berseem Clover (Trifolium Alexandrinum L.) Pasture. Grass Forage Sci. 2017, 72, 194–210. [Google Scholar] [CrossRef]
- Kleanthous, N.; Hussain, A.; Khan, W.; Sneddon, J.; Liatsis, P. Deep Transfer Learning in Sheep Activity Recognition Using Accelerometer Data. Expert Syst. Appl. 2022, 207, 117925. [Google Scholar] [CrossRef]
- Mansbridge, N.; Mitsch, J.; Bollard, N.; Ellis, K.; Miguel-Pacheco, G.G.; Dottorini, T.; Kaler, J. Feature Selection and Comparison of Machine Learning Algorithms in Classification of Grazing and Rumination Behaviour in Sheep. Sensors 2018, 18, 3532. [Google Scholar] [CrossRef]
- Arnold, G.W. Comparison of the Time Budgets and Circadian Patterns of Maintenance Activities in Sheep, Cattle and Horses Grouped Together. Appl. Anim. Behav. Sci. 1984, 13, 19–30. [Google Scholar] [CrossRef]
- Dove, H.; Beilharz, R.G.; Black, J.L. Dominance Patterns and Positional Behaviour of Sheep in Yards. Anim. Sci. 1974, 19, 157–168. [Google Scholar] [CrossRef]
- Mozo, R.; Alabart, J.L.; Rivas, E.; Folch, J. New Method to Automatically Evaluate the Sexual Activity of the Ram Based on Accelerometer Records. Small Rumin. Res. 2019, 172, 16–22. [Google Scholar] [CrossRef]
- Alhamada, M.; Debus, N.; Lurette, A.; Bocquier, F. Automatic Oestrus Detection System Enables Monitoring of Sexual Behaviour in Sheep. Small Rumin. Res. 2017, 149, 105–111. [Google Scholar] [CrossRef]
- Dobos, R.C.; Dickson, S.; Bailey, D.W.; Trotter, M.G. The Use of GNSS Technology to Identify Lambing Behaviour in Pregnant Grazing Merino Ewes. Anim. Prod. Sci. 2014, 54, 1722–1727. [Google Scholar] [CrossRef]
- Barwick, J.; Lamb, D.; Dobos, R.; Schneider, D.; Welch, M.; Trotter, M. Predicting Lameness in Sheep Activity Using Tri-Axial Acceleration Signals. Animals 2018, 8, 12. [Google Scholar] [CrossRef] [PubMed] [Green Version]
- Ikurior, S.J.; Marquetoux, N.; Leu, S.T.; Corner-thomas, R.A.; Scott, I.; Pomroy, W.E. What Are Sheep Doing? Tri-Axial Accelerometer Sensor Data Identify the Diel Activity Pattern of Ewe Lambs on Pasture. Sensors 2021, 21, 6816. [Google Scholar] [CrossRef] [PubMed]
- Cardoso, A.; Pereira, J.; Nóbrega, L.; Gonçalves, P.; Pedreiras, P.; Silva, V. SheepIT: Activity and Location Monitoring. In Proceedings of the INForum 2018-Simpósio de Informática, Coimbra, Portugal, 3–4 September 2018. [Google Scholar]
- Gonçalves, P.; Nóbrega, L.; Monteiro, A.; Pedreiras, P.; Rodrigues, P.; Esteves, F. SheepIT, an E-Shepherd System for Weed Control in Vineyards: Experimental Results and Lessons Learned. Animals 2021, 11, 2625. [Google Scholar] [CrossRef] [PubMed]
- Fogarty, E.S.; Swain, D.L.; Cronin, G.; Trotter, M. Autonomous On-Animal Sensors in Sheep Research: A Systematic Review. Comput. Electron. Agric. 2018, 150, 245–256. [Google Scholar] [CrossRef]
- Sevi, A.; Casamassima, D.; Management, A.M.-J. Undefined Group Size Effects on Grazing Behaviour and Efficiency in Sheep. Rangel. Ecol. Manag. J. Range Manag. Arch. 1999, 52, 327–331. [Google Scholar]
- Molle, G.; Decandia, M.; Cabiddu, A.; Landau, S.Y.; Cannas, A. An Update on the Nutrition of Dairy Sheep Grazing Mediterranean Pastures. Small Rumin. Res. 2008, 77, 93–112. [Google Scholar] [CrossRef]
- Balch, C.C. Sleep in Ruminants. Nature 1955, 175, 940–941. [Google Scholar] [CrossRef]
- Toutain, P.-L.; Toutain, C.; Webster, A.J.F.; McDonald, J.D. Sleep and Activity, Age and Fatness, and the Energy Expenditure of Confined Sheep. Br. J. Nutr. 1977, 38, 445–454. [Google Scholar] [CrossRef]
- Szeto, H.H.; Hinman, D.J. Prenatal Development of Sleep-Wake Patterns in Sheep. Sleep 1985, 8, 347–355. [Google Scholar] [CrossRef]
- Matsuda, K.; Ducsay, C.; Koos, B.J. Fetal Breathing, Sleep State and Cardiovascular Adaptations to Anaemia in Sheep. J. Physiol. 1992, 445, 713–723. [Google Scholar] [CrossRef]
- Harding, R.; Rawson, J.A.; Griffiths, P.A.; Thorburn, G.D. The Influence of Acute Hypoxia and Sleep States on the Electrical Activity of the Cerebellum in the Sheep Fetus. Electroencephalogr. Clin. Neurophysiol. 1984, 57, 166–173. [Google Scholar] [CrossRef]
- Schneider, W.T.; Vas, S.; Nicol, A.U.; Jennifer Morton, A. Abnormally Abrupt Transitions from Sleep-to-Wake in Huntington’s Disease Sheep (Ovis Aries) Are Revealed by Automated Analysis of Sleep/Wake Transition Dynamics. PLoS ONE 2021, 16, e0251767. [Google Scholar] [CrossRef] [PubMed]
- Ifarmtec Webpage. Available online: http://www.ifarmtec.pt (accessed on 20 May 2022).
- Nóbrega, L.; Gonçalves, P.; Pedreiras, P.; Pereira, J. An IoT-Based Solution for Intelligent Farming. Sensors 2019, 19, 603. [Google Scholar] [CrossRef] [PubMed]
- Nóbrega, L.; Gonçalves, P.; Antunes, M.; Corujo, D. Assessing Sheep Behavior through Low-Power Microcontrollers in Smart Agriculture Scenarios. Comput. Electron. Agric. 2020, 173, 105444. [Google Scholar] [CrossRef]
Figure 1.
Monitoring platform overview.

Figure 2.
Photo from sheep sheepfold.

Figure 4.
Weekly distribution of records.

Figure 5.
Record distribution by status/hour.

Figure 6.
Attribute correlations.

Figure 7.
Quartile distribution for (A) pitch and (B) roll angles.

Figure 8.
Record distribution by hour.

Figure 10.
Effect of neck rotation on the ultrasound measures.

Figure 11.
Example of an image taken by the video camera.

Table 1.
Final dataset structure.
| Attribute | Content |
|---|---|
| ID | Animal identification |
| Timestamp | Timestamp of record |
| Year | Year |
| Month | Month |
| Day | Day |
| Hour | Hour |
| Minute | Minute |
| Second | Second |
| wd | Weekday |
| S | Status (‘S’,’E’,’M’,’X’,’R’) |
| Dist | Neck distance to ground (mm) |
| Pitch | Pitch angle (degrees) |
| Roll | Roll angle (degrees) |
| Dx | Accelerometer delta in X axis |
| Dy | Accelerometer delta in Y axis |
| Dz | Accelerometer delta in Z axis |
Publisher’s Note: MDPI stays neutral with regard to jurisdictional claims in published maps and institutional affiliations. |
© 2022 by the authors. Licensee MDPI, Basel, Switzerland. This article is an open access article distributed under the terms and conditions of the Creative Commons Attribution (CC BY) license (https://creativecommons.org/licenses/by/4.0/).
Share and Cite
MDPI and ACS Style
Monteiro, A.; Gonçalves, P.; Marques, M.R.; Belo, A.T.; Braz, F. Sheep Nocturnal Activity Dataset. Data 2022, 7, 134. https://doi.org/10.3390/data7090134
AMA Style
Monteiro A, Gonçalves P, Marques MR, Belo AT, Braz F. Sheep Nocturnal Activity Dataset. Data. 2022; 7(9):134. https://doi.org/10.3390/data7090134
Chicago/Turabian StyleMonteiro, António, Pedro Gonçalves, Maria R. Marques, Ana T. Belo, and Fernando Braz. 2022. "Sheep Nocturnal Activity Dataset" Data 7, no. 9: 134. https://doi.org/10.3390/data7090134