Article

Calcium Biofortification of Rocha Pear Fruits: Implications on Mineral Elements, Sugars and Fatty Acids Accumulation in Tissues

by
Cláudia Campos Pessoa
1,2,*,
Fernando C. Lidon
1,2,
Diana Daccak
1,2,
Inês Carmo Luís
1,2,
Ana Coelho Marques
1,2,
Ana Rita F. Coelho
1,2,
Paulo Legoinha
1,2,
José Cochicho Ramalho
2,3,
António E. Leitão
2,3,
Mauro Guerra
4,
Roberta G. Leitão
4,
Paula Scotti Campos
2,5,
Isabel P. Pais
2,5,
Maria Manuela Silva
2,6,
Fernando H. Reboredo
1,2,
Maria Fernanda Pessoa
1,2 and
Manuela Simões
1,2
1
Earth Sciences Department, Faculdade de Ciências e Tecnologia, Universidade Nova de Lisboa, Campus da Caparica, 2829-516 Caparica, Portugal
2
GeoBioTec Research Center, Faculdade de Ciências e Tecnologia, Universidade Nova de Lisboa, Campus da Caparica, 2829-516 Caparica, Portugal
3
PlantStress & Biodiversity Lab, Centro de Estudos Florestais (CEF), Instituto Superior de Agronomia (ISA), Universidade de Lisboa (ULisboa), Quinta do Marquês, Avenida da República, 2784-505 Oeiras, and Tapada da Ajuda, 1349-017 Lisboa, Portugal
4
LIBPhys-UNL, Physics Department, Faculdade de Ciências e Tecnologia, Universidade Nova de Lisboa, Campus da Caparica, 2829-516 Caparica, Portugal
5
Instituto Nacional de Investigação Agrária e Veterinária I.P. (INIAV), Quinta do Marquês, Avenida da República, 2780-157 Oeiras, Portugal
6
ESEAG-COFAC, Avenida do Campo Grande 376, 1749-024 Lisboa, Portugal
*
Author to whom correspondence should be addressed.
Submission received: 25 July 2022 / Revised: 5 September 2022 / Accepted: 15 September 2022 / Published: 21 September 2022
(This article belongs to the Special Issue Biofortification of Foods of Vegetable Origin)

Abstract

:
Following an agronomic approach for the Ca enrichment of Rocha pears, this study aimed to assess the interactions between mineral nutrients in fruit tissues at harvest and after storage for 5 months and to characterize the implications on the profile of sugars and fatty acids (FA). A total of seven foliar sprays (with concentrations of 0.1–0.6 kg·ha−1 Ca(NO3)2 and 0.8–8 kg·ha−1 CaCl2) were applied to pear trees. After harvest, the fruits were stored for 5 months, in environmentally controlled chambers, and the mineral contents in five regions (on the equatorial section) of the fruits were assessed, while the sugar and FA content were quantified. For both dates, all foliar sprayed treatments, at different extends, increased Ca content in the center and near the epidermis of Rocha pear fruits and the levels of K, Mn, Fe, Zn and Cu also varied. At harvest, the Ca treatments did not affect the levels of sucrose, glucose, fructose and sorbitol and, after storage, their concentrations remained higher in Ca-treated fruits. Additionally, the tendency of the relative proportions of FA was C18:2 > C18:1 > C16:0 > C18:3 > C18:0 > chains inferior to 16 C (<16:0), but after storage it was C18:2 > C16:0 > C18:3 > C18:0 > C18:1 > chains inferior to 16 C (<16:0). It is concluded that the heterogeneous distribution of Ca in the tissues of Rocha pear fruits results from its absorption in the peel after Ca(NO3)2 and CaCl2 sprays and from the xylemic flux in the core prior to maturity. Additionally, the hydrolysis of complex polysaccharides affects the contents of simpler sugars during maturation, ripening and senescence, while storage decreases the amount of total fatty acids (TFA), but the double bond index (DBI) indicate that cell membrane fluidity remains unaffected.

1. Introduction

A deficient Ca intake from one’s diet affects half the global population [1], leading to a progressive loss of bone mass, favoring the development of pathologies such as osteopenia, which, when aggravated, can be diagnosed as osteoporosis [2,3]. In children, despite vitamin D deficiencies being the main cause, Ca-mediated deformities such as rickets can also occur [4]. Calcium intake varies with age or gender, being required in quantities higher than 100 mg/day [5]. A study by Cormick and Belizán (2019) [6] compiled information from four different sources (SACN, IOM, EFSA and the WHO—from the United Kingdom, the United States of America and Canada, Europe and the FAO) and showed that the recommended daily values varied between 200 to 1300 mg (presenting differences even when considering the individual`s same characteristics). It further indicated for adults (over 19 years old) an average daily intake of Ca between 800–1300 mg [6] but, over a long period of time, the daily intake should not exceed 2000–3000 mg to avoid compromises in health [6,7].
Plant biofortification focuses on the increase in a target mineral in the edible part of a chosen genotype. This can be achieved by different strategies, such as DNA modification (the transgenic approach), the selection of favorable characteristics (the breeding approach) or the use of foliar/soil fertilizers (the agronomic approach) [8]. According to Garg et al. (2018) [9], transgenic, breeding and agronomic approaches prevail in cereals and, although the mineral enrichment of fruits might be carried out with the three approaches, fruits present the lesser number of studies in both agronomic and breeding techniques. However, relative to fruits and other vegetables, the content of Ca in cereals is low (e.g., to meet daily Ca needs in adults, a diet exclusively with cereals could imply the intake of up to 10 kg) [10]. Additionally, food products with lower contents of antinutrients are preferable, as the presence of phytates and oxalates can affect the bioavailability of Ca [10,11,12]. In fact, the level of phytic acid is higher in cereals, oilseeds and legumes (on a dry weight basis varying between 1–5%), in comparison to other vegetables and fruits such as carrots or bananas (on a dry weight basis varies between 0.015–0.09%) [13]. Oxalates also prevail in fruits such as kiwi, avocado or oranges (about 16–29 mg per portion), in comparison to other fruits such as pears (which ranges between 1–3 mg) [14].
Pre-harvest factors (such as mineral nutrition, chemical treatments, agronomic practices or climacteric aspects) affect the post-harvest quality and physiology of fruits, as at that point quality can only be maintained but not improved [15]. Yet, the enrichment of several fruits, namely pears, with foliar applications of Ca (during the pre-harvest phase), besides increasing the amounts of this nutrient, maintains its quality during storage and triggers some positive changes in the organoleptic properties, such as aroma [16,17,18,19,20,21,22]. Nevertheless, the mineral content of pears varies according to the variety [23,24], being its sweetness related to the content of sugars, namely sorbitol, glucose, fructose and sucrose [23,24]. Additionally, lipids, although present in low quantities (with contents varying according to the storage method), are not just linked to the membrane structure of cells, but also to the biosynthesis of aroma volatiles [24,25,26].
Rocha pear is a Portuguese variety that can be stored in environmentally controlled chambers, at least up till seven to eight months, while it is also resistant to handling and transport, allowing its marketability to consumers for most of the year (e.g., about 8 months after harvest) [27]. As Rocha pear is a climacteric fruit, storage conditions are thus crucial, since it persists in being physiologically active during the post-harvest period [28]. Following an agronomic approach for the Ca enrichment of Rocha pears, this study aimed to assess the interactions among mineral nutrients in the fruit tissues between harvest and storage for 5 months and to assess the related profile of sugars and fatty acids (FA). Thus, quality modifications in Rocha pear fruits resulting from Ca increases in fruit tissues was assed to determine eventual changes in other minerals localization, as well as in some related nutritional aspects.

2. Materials and Methods

2.1. Experimental Design

In an orchard located in Portugal (GPS coordinates 39°29′52.641″ N; 9° 1′19.604″ W), an agronomic workflow comprising seven foliar sprays (spaced 15 days between each) was carried out between 11 May and 23 August of 2018 on Rocha pear trees (Pyrus communis L.). For the first two foliar applications, different sets of trees (four trees per set) were sprayed with 0.1 and 0.6 kg·ha−1 Ca(NO3)2 and 0.8 and 1.6 kg·ha−1 CaCl2 (corresponding to treatments T0.1 and T0.6, as well as T0.8 and T1.6, respectively). Another set (twelve trees) was kept as the control, only being applied water without any other fertilizers. For the subsequent third and the remaining 4 foliar applications, respectively, 4 and 8 kg·ha−1 of CaCl2 were applied to all the four sets. Water accumulation from rainfall during the foliar application period reached 60.4 mm, with an average value of 0.41 mm, reaching a daily maximum of 18.03 mm. Temperatures varied between 6 °C and 41 °C, with minimum and maximum mean values of 15 °C and 23 °C, respectively. The fruits were harvested on 10 September and each treatment was stored in environmentally controlled chambers (at −0.5–1 °C and 95% humidity). An analysis of the stored samples occurred on 13 March 2019.

2.2. Mineral Elements Content in Fruits

Quantitative determinations of Ca, K, Mn, Fe, Zn and Cu in fruits were assessed by using a micro-Energy Dispersive X-ray-Fluorescence system (µ-EDXRF) (M4 TornadoTM Bruker, Germany) as described in Luís et al. (2021) [29], with adaptations regarding sample preparation. Fruits were firstly cleaned with deionized water and then horizontally sliced at the equatorial zone with a stainless-steel blade. The slices were dried at 60 °C until constant weight (Figure 1). An example of the different zones is present in Figure 1.

2.3. Sugar Content in Fruits

Sugar extraction followed the procedure of Medlicott and Thompson (1985) [30]. A total of fifteen pears per treatment (n = 3, thus 5 fruits per sample) were firstly cleaned with deionized water and then peeled, followed by a longitudinal cut. A total of 40 g of pulp (8 g per fruit) per sample was added to 150 mL of cold ultrapure water and liquified, followed by the addition of ultrapure water until 200 mL. Samples were kept in ice, then were transferred to ultrasounds (for 5 min) and were later centrifuged (15,000 g, 15 min, 4 °C). The supernatant was transferred to glass tubes in ice, while the pellet was resuspended in ultrapure water following a new centrifuge in the same conditions. The supernatants were added and after homogenization, 20 mL were transferred to glass tubes and put in a boiling bath (for 4 min). Then, the tubes were removed and put into ice (6 min), and once cold, the samples were centrifuged (15,000 g, 20 min, 4 °C). The samples were then filtered (nylon 0.45 mm) and stored until injection. The samples were injected in an HPLC (Waters, Milford, DE, USA), coupled to a refractometric detector (Waters 2414), equipped with a SugarPak 1 column (Waters 6.5 × 300 mm) and pre-column (Wat 088141) with SugarPak II inserts (Wat 015209). Ultrapure water containing 50 ppm calcium EDTA was used as the mobile phase, with a flow of 0.5 mL min−1, and an injection volume of 40 µL for each sample. The data were later analyzed with the software Breeze and a quantification was performed based on the calibration curves of sucrose, glucose, fructose and sorbitol.

2.4. Lipid Content in Fruits

A total of twenty pears per treatment (n = 4, thus 5 fruits per sample) were selected and cleaned with deionized water and then peeled. A total of 5 g of pulp (1 g per fruit) per sample were weighted. Fatty acid composition was determined according to Vidigal et al. (2018) [31]. To each sample, 10 mL of a solution of methanol: sulfuric acid (CH3OH:H2SO4, 39:1, v:v) were added, followed by the addition of an internal standard (C17:0, heptadecanoic acid). The tubes (with a teflon stopper and septum) were then transferred to a 70 °C bath (for 60 min). Once cooled, 10 mL of petroleum ether and 6.7 mL of ultrapure water were added. After homogenization with vortex, they were left to decant (for 60 min), followed by the removal of the top phase to tubes with a teflon cap. The tubes were put to dry in a 40 °C bath and under a stream of nitrogen, being then resuspended in GC-grade n-Hexane, and then the sample was stored in a vial with a teflon septum at −80 °C until injection.
Esterified fatty acids were analyzed on a gas–liquid chromatograph (CP-3380, Varian, Palo Alto, Santa Clara, CA, USA), coupled to a flame ionization detector (GC-FID) and separated by means of a Varian capillary column (CP-Wax 52 CB). Total fatty acids (TFA) and the relative abundance of fatty acids (in %) were attained. The degree of unsaturation was obtained through the unsaturation index (DBI—double bond index), which reflects the relative abundance of mono- and polyunsaturated fatty acids in relation to saturated fatty acids, obtained by using the formula: DBI = [(X% monoenes + 2 X% dienes + 3 X% trienes)/% saturated fatty acids], according to Mazliak (1983) [32].

2.5. Statistic

Statistical analysis was carried out using a Two-Way ANOVA (p ≤ 0.05) to assess the differences; then, a Tukey’s for mean comparison was performed, considering a 95% confidence level. Letters a, b and c represent significant differences among treatments for each date or between regions, while A and B represent significant differences between the analytical dates for each treatment.

3. Results

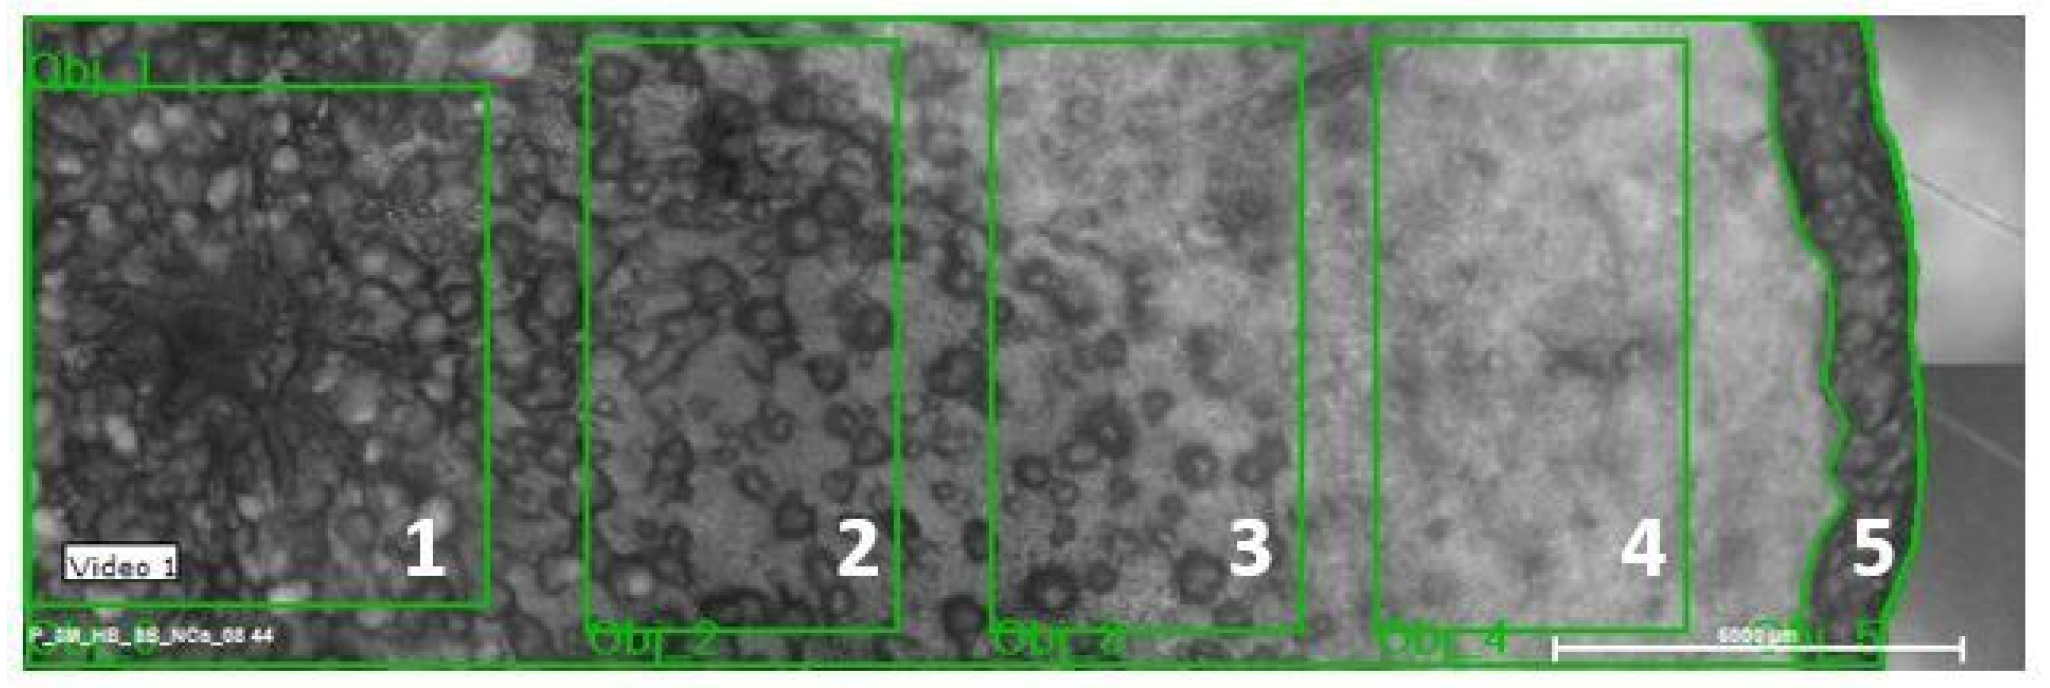
3.1. Mineral Quantification and Location in Rocha Pear Fruits

At harvest, the five zones of the equatorial region of all treatments of Rocha pear fruits revealed (Figure 2) higher Ca contents than the control. Calcium showed a heterogeneous distribution in fruit tissues, prevailing in the center (zone 1) and near the epidermis (zone 5). Relative to all the analyzed minerals, the content of K prevailed. However, for most treatments (except T0.6), zones 1 and 3 displayed levels of K inferior to the control (Figure 2), with higher values occurring near the epidermis (zones 4 and 5). Concerning Mn (Figure 2), relative to the control, all the sprayed fruits presented higher values in four regions (except T1.6 in only three zones). Iron and Zn content (Figure 2) was higher in all zones of the sprayed fruits (except for treatment T1.6 in zones 3 and 4). For Cu (Figure 2), inferior values occurred only in three zones of treatment T1.6 and zone 1 of treatment T0.8.
After 5 months of storage, relative to the control, all the sprayed fruits displayed higher values for Ca (Table 1) in all five zones. However, Ca heterogeneous distribution in fruit tissues persisted, with higher values prevailing in the core (e.g., center) and near the epidermis (zone 1 and 5, respectively). Relative to the other minerals, K maintained the highest content. Nevertheless, like at harvest, for most treatments (except T0.6), zones 1 and 2 showed (Table 1) lower values than the control, whereas higher values occurred in zones 3, 4 and 5 (except zone 5 for treatment T0.1). Relative to the control, Mn in the sprayed fruits revealed inferior values only in zone 1, remaining higher in four regions as at harvest (Figure 2). The zinc values (Table 1) in the sprayed fruits were only inferior in zones 1 and 2 (except for treatment T0.8). Similarly for Fe (Table 1), the same two zones per treatment were inferior to the control (except for treatment T0.8 and zone 5 for T0.6). Copper values (Table 1) remained lower in zones 1 and 2 and for T0.1 also in zone 5.
Following a general perspective, in stored Rocha pears, Ca at different extends triggered a heterogeneous distribution of minerals (Table 1). Calcium increases in the interior part of the fruits occurred (zone 1 to 4, except zone 4 for treatment T0.8), whereas K prevailed in the middle region of the pulp (zones 3 and 4), and for the remaining mineral elements content (Mn, Fe, Zn and Cu), slight decreases in the treatments with sprays of Ca(NO3)2 occurred.

3.2. Sugar and Lipid Content

At harvest, no significant differences occurred among the Rocha pear treatments, but the contents of fructose prevailed in all the treatments (Table 2). After 5 months of storage, relative to the control, sucrose revealed significantly higher values in T0.1 and T0.6, whereas in glucose and fructose this occurred in T0.1 (Table 2). Relative to the control, sorbitol and total sugar levels (Table 2) also displayed higher values in T0.1 and T1.6.
Relative to the harvest period, after 5 months storage (Table 2), the levels of sucrose significantly decreased in Ctr, T0.6 and T0.8 (to 17%, 36% and 28%, respectively), whereas glucose and fructose did not vary significantly in all treatments (except T0.1, which showed 2.52- and 2.15-fold increases, respectively), and sorbitol revealed a substantial increase in T0.1 and a decrease in T0.8 (2.08-fold and to 63%, respectively). In this context, the total sugars showed significantly higher and lower values for T0.1 and T0.8, respectively (Table 2).
At harvest, TFA did not reveal significant variations among treatments (Table 3). For fatty acids <16:0, treatment T0.8 was significantly higher than the control, while C16:0 showed significantly lower values in T0.1 in regard to T0.8 (Table 3). In this context, when compared with the control, C18:0 and C18:2 did not reveal any significant deviations, but C18:1 significantly decreased with the application of CaCl2, whereas C18:3 increased significantly in T1.6 (Table 3). Relative to the control, the DBI of the sprayed fruits did not vary significantly.
After 5 months of storage, significant differences could not be found among treatments for TFA, fatty acids <16:0, C16:0, C18:0, C18:1 and the DBI but, relative to the control, C18:2 and C18:3 showed significantly higher and lower values for T1.6, respectively (Table 3).
Relative to the harvest period, after 5 months of storage, TFA and C18:1 decreased significantly in all treatments, but significantly higher values (3.21-fold) were found for T0.1 of fatty acids <16:0 (Table 3). All treatments of C16:0 significantly augmented after 5 months of storage, but the opposite occurred with C18:0 (except T1.6) (Table 3). At harvest, and relative to 5 months of storage, C18:2 revealed significantly lower values in T1.6 (decreased 19.8%), whereas in C18:3 a similar trend was found with Ctr, T0.1 and T0.6 (decreased 72%, 64.4% and 75.2%, respectively). After 5 months of storage, significantly lower DBI values were only found for T0.1

4. Discussion

As previously found in different pear varieties [16,17,18,19,20,33] and apples [34,35], pre-harvest foliar spraying with Ca (with either Ca(NO3)2 or CaCl2) increased this mineral content in Rocha pear fruits at harvest (Figure 2). Calcium can be applied in the soil or via foliar spraying (excluding soil as “intermediate”), but its solubility (varying with the chosen chemical compound) also affects the availability for plant absorption [36]. In fact, CaCl2 (commonly applied by foliar sprays) and Ca(NO3)2 (commonly applied on soil or through fertirrigation) are soluble compounds that become rapidly available in comparison to other sources such as calcium carbonate (CaCO3) or calcium sulfate (CaSO4) [36]. Nevertheless, Ca accumulation in fruits can vary with phase and frequency of fertilizer application during production, edaphoclimatic conditions or genotype [37]. For instance, for apples, up to 90% of Ca assimilation can occur in the first 4 to 6 weeks after bloom [36], whereas for Rocha pears this period can range from budbreak up to 30 to 40 days after bloom [38]. However, the use of lower concentrations (0.5–2.0%) is advised in the initial stages of the production cycle to avoid damaging plant structures such as leaves, while higher concentrations can be applied later since the effects on trees or fruits is low [37,38]. In this context, Ca(NO3)2 has a more pronounced effect on fruits, while CaCl2 mainly affects leaves [39]. Indeed, after spraying Conference pears with CaCl2 (between 10 kg·ha−1–25 kg·ha−1), damages could not be found [18]. Concerning the contents of nutrients in Rocha pears, depending on the edaphoclimatic conditions and fertilization workflows, some heterogeneity has been reported. For instance, according to PortFIR (2022) [24,40], K content prevails in larger quantities (150 mg/100 g FW, 960 mg/100 g DW), followed by Ca (9 mg/100 g FW, 57 mg/100 g DW), Fe (0.3 mg/100 g FW, 1.9 mg/100 g DW) and Zn (0.2 mg/100 g FW, 1.3 mg/100 g DW). In another study by Mendes (2017) [41] about the content in healthy Rocha pear fruits from five orchards, after storage from 3 to 6 months, the contents (on a dry weight basis) for K, Ca, Fe, Zn, Cu and Mn were 10.3–15.0 g/kg, 0.4–0.9 g/kg, 13.5–25.7 mg/kg, 8.0–13.9 mg/kg, 5.1–11.5 mg/kg and 1.8–3.3 mg/kg, respectively. Complementary, a different study by Saquet et al. (2019) [42], with Rocha pear fruits from four different orchards, showed that after 22 weeks of storage, the contents on a dry weight basis of K, Ca, Fe, Zn, Cu and Mn were 10.3–15.0 g/kg, 0.5–0.9 g/kg, 14.3–25.6 mg/kg, 8.0–13.8 mg/kg, 6.1–10.8 mg/kg and 1.7–3.4 mg/kg, respectively. In this context, at harvest (Figure 2) and after storage (Table 1), our data also revealed that mineral ranges followed macronutrients and micronutrients classification [43]. Furthermore, Saquet et al. (2019) [42] also found that in Rocha pears prevails a radial decrease in Ca, Fe, Mn, Zn and Cu contents from the fruit skin to inner flesh tissues (but K values followed an opposite trend) and Raese and Drake (2000) [33] studying the application of CaCl2 in a different variety also detected a similar trend for Ca accumulation between the cortex and the peel (471–524 ppm and 1563–1729). A putative explanation for the heterogeneous distribution of Ca among the tissues of the Rocha pears fruits (Figure 2; Table 1) might implicate its absorption after spraying as well as the progressive inhibition of mineral influx to the fruits in the later stages of development, due to xylemic vessel degradation [37,44]. Accordingly, in the initial phases of fruits development, Ca accumulation implicates its absorption at the epidermis but also its accumulation through xylem flux in the core. Moreover, after a progressive degradation of the xylem vessels, Ca diffusion from the epidermis to the core of the fruit was responsible for different accumulation patterns within Rocha pear tissues until harvest and during storage (Figure 2; Table 1). Mineral enrichment in plant species determines synergistic or antagonistic interactions among mineral accumulation [45]. Nevertheless, at harvest and in most of the treatments, the general increase in K, Fe, Mn, Zn and Cu in Rocha pears clearly points a synergism with Ca accumulation (Figure 2). Moreover, in plant species, antagonistic interactions between Ca and K, due to the similar chemical characteristics, often leading to competition for uptake or transport, have been reported [45]. Additionally, the capacity of large amounts of Ca to modify the permeability of cell membranes has been link to the inhibitory effect on K contents [45]. However, in the tissues of Rocha pear fruits, an opposite trend was found since K mobilization and accumulation occurred preferable outside the core zones from harvest and during storage (Table 1). This tendency was also found in apples [35,46,47] and tubers [48] after spraying with CaCl2 and with Ca(NO3)2, and in pears [17] with CaCl2. Although Fe, Mn and Cu have a low mobility in plant tissues, while Zn keeps an intermediate translocation [43,48,49,50,51], the increasing contents of Ca in pear Rocha fruits did not have a negative impact on micronutrients accumulation (Figure 2), and still with storage their concentrations prevailed outside the core zones (Table 1). Nevertheless, the interactions between Ca and Zn, Mn, Fe and Cu seem to depend on plant genotypes and growth conditions. In fact, a study by Lidon et al. (2014) [52] showed that Zn and Mn either maintained or significantly decreased in two apple varieties sprayed with Ca(NO3)2 and CaCl2, while Fe and Cu increased for the variety ‘Golden Delicious’ but decreased for ‘Jonagold’. Concerning grapes, synergistic and antagonistic interactions were also found between Zn and Ca accumulations in the varieties ‘Castelão’ and ‘Moscatel’, respectively [50]. Additionally, in two varieties of tubers, the increasing accumulation of Ca triggered by Ca(NO3)2 and CaCl2 foliar spraying presented different accumulation trends of Fe and Zn [48].
Sugars are a product of photosynthesis, accounting as a source of energy for plants [53] and further contributing to fruits’ flavor (namely sweetness), color, texture and nutritional values [54,55]. According to PortFir (2022), ANP (2022) and Yahia et al. (2019) [24,27,55], among the different varieties of pear fruits, the amount of total sugars usually varies between 6.50 g/100 g FW and 13.20 g/100 g FW, with this amount only surpassed by water content. However, at harvest, the control and treated Rocha pears in some cases displayed higher values (Table 2), which can be attributed namely to the specificity of the genotype characteristics (as found from a total of 22 varieties of pears [56]) and edaphoclimatic conditions [15]. Additionally, still at harvest, the absence of significant differences in each sugar among treatments (Table 2) indicated that foliar applications with Ca did not have a negative impact on sugar content. After 5 months of storage, relative to the control, the average content of all sugars from the different Ca treatments showed higher values (Table 2). The sugar content of fruits changes during the maturation, ripening and senescence phases, due to the hydrolysis of complex polysaccharides (such as starch synthesized in the early stages of fruit development) into simpler sugars (such as glucose), thus increasing fruit sweetness [57]. These changes keep occurring during pear storage since they are climacteric fruits, and thus maintain metabolic activities such as respiration [28]. The main photoassimilate produced by photosynthesis and transported to apples or pears is sorbitol (i.e., the translocation of 60–85% of the carbon, the rest being sucrose [44]). Nevertheless, as found in our study (Table 2), polyols such as sorbitol can only account for 0.003–6.8 g/100 g FW [55] because its conversion into other sugars (such as glucose, fructose, sucrose and starch) occurs during the ripening stage when it reaches the fruit [44]. Additionally, in fruits, sucrose is either transported from other plant tissues or is synthetized from the existent sorbitol [58], whereas its decrease with storage relates to hydrolysis reactions into its monomers [55].
In plant tissues, FA synthesis, which prevails in plastids (through the catabolism of sugars produced during photosynthesis, namely glucose), tends to end at chain lengths of C16:0 to C18:0, although further elongation reactions can occur [59]. Additionally, enzymes can then catalyze the introduction of a double bond to C18:0 molecules, producing C18:1, C18:2 or C18:3 [59]. At harvest, independent of Ca treatments, linoleic acid (C18:2) and oleic acid (C18:1) prevailed in Rocha pears, followed by palmitic acid (C16:0), stearic acid (C18:0) and α-linolenic (C18:3), with FA having chains inferior to 16 C (<16:0), accounting for the lowest values (Table 3). A somewhat similar accumulation pattern was also found in the pear varieties ‘Shughri’ and ‘Physhu’ [60] and apples (‘Golden Delicious’) [59,61]. In fact, in the pear varieties ‘Shughri’ and ‘Physhu’, the prevailing FA were linoleic acid (C18:2), palmitic acid (C16:0), oleic acid (C18:1) and α-linoleic acid (C18:3) [60]. Yet, in the pulp of apples (‘Golden Delicious’), according to Domínguez-Avila and González-Aguilar (2019) [59], palmitic (C16:0, 0.017 g/100 g), stearic (C18:0, 0.002 g/100 g), oleic (C18:1, 0.005 g/100 g), linoleic (C18:2, 0.031 g/100 g) and α-linolenic (C18:3, 0.007 g/100 g) acids showed higher amounts, whereas Duroňová (2012) [61] reported that the prevailing contents were palmitic (C16:0), stearic (C18:0), oleic, linoleic (C18:2) and α-linolenic (C18:3) acids. Nevertheless, as found in apples [59], the TFA contents of Rocha pears (Table 3) followed a similar trend, remaining under 0.8 g/100 g FW. Moreover, the effect of Ca treatments, using CaCl2 on Rocha pear trees, revealed some minor relevant impacts in the FA profile of the fruits, but after storage, the significant decrease in TFA resulted in slight modifications to the FA relative abundance and led to profile modifications, with linoleic acid (C18:2) remaining as the highest FA, followed by palmitic acid (16:0) and α-linolenic (C18:3) and then oleic (C18:0) and stearic (C18:1) acids, with FA having chains inferior to 16 C (<16:0) remaining as the lowest values. Like Ca, FA perform important structural roles in fruits by being a part of cell membranes, and instability (such as TFA decreases or changes in FA saturation degree) during storage can favor the development of disorders [61]. Thus, the unsaturation level of membrane lipids can compromise its functioning by affecting the selectivity of this permeable barrier, influencing cells’ correct functioning [62]. In this context, the double bond index (DBI) is indicative of unsaturation level, since it measures the average number of double bonds in FA. Accordingly, the general absence of significant differences concerning Ca sprays or storage time (except in T0.1–Table 3) suggests that membrane fluidity was not affected, avoiding ion losses or compromises in cell compartmentation [62]. This is in accordance with the Ca impact in cell membranes mentioned by Deng (2008) [63], namely of the latest’s integrity (impacting turgor pressure and permeability), which can be related to the Ca stabilization of lipid bilayers by binding to phospholipids, and the induced reduction in membrane permeability by shrinkage of the membrane surface of plant cells [64]. However, according to Brizzolara et al. (2020) [62], the knowledge of lipid metabolism in stored fruits is still limited, especially in comparison to other studies involving sugars and ethylene signaling.

5. Conclusions

Trees of Rocha pears sprayed with Ca(NO3)2 and CaCl2 increase Ca content in the center and near the epidermis of the fruits and further affects the levels of all the studied minerals in tissues. The heterogeneous distribution of Ca for both moments of analysis results from its absorption in the peel of the fruit after Ca(NO3)2 and CaCl2 spraying and from the xylem flux in the core prior to maturity. The differential Ca accumulation among tissues of Rocha pears does not affect the permeability of cell membranes and therefore K and micronutrients accumulation were not inhibited. Additionally, at harvest, Ca does not affect the levels of the four analyzed sugars, and after storage, their concentration remains higher in Ca-treated fruits. At harvest and independent of Ca treatments, the relative proportions of FA in Rocha pears remained, but after storage the treatments with Ca displayed a different trend. In this context, storage decreases the amount of TFA; however, the DBI indicates that cell membrane fluidity remains unaffected.

Author Contributions

Conceptualization, C.C.P. and F.C.L.; methodology, F.C.L., J.C.R., M.G. and P.S.C.; software, C.C.P.; formal analysis, C.C.P., D.D., I.C.L., A.C.M., A.R.F.C., J.C.R., A.E.L., M.G., R.G.L., P.S.C. and I.P.P.; investigation, C.C.P., D.D., I.C.L., A.C.M. and A.R.F.C.; resources, P.L., M.M.S., F.H.R., M.F.P. and M.S.; writing—original draft preparation, C.C.P. and F.C.L.; writing—review and editing, C.C.P. and F.C.L.; supervision, F.C.L.; project administration, F.C.L.; funding acquisition, F.C.L. All authors have read and agreed to the published version of the manuscript.

Funding

This work received funding from PDR2020-101-030734 and Fundação para a Ciência e a Tecnologia, I.P. (FCT), Portugal, through the research units UIDB/04035/2020 (GeoBioTec), UIDB/00239/2020 (CEF) and UID/FIS/04559/2020 (LIBPhys) from the FCT/MCTES/PIDDAC. This work was further supported by the grant of Fundação para a Ciência e Tecnologia (FCT) UI/BD/150718/2020.

Institutional Review Board Statement

Not applicable.

Informed Consent Statement

Not applicable.

Data Availability Statement

Not applicable.

Acknowledgments

The authors thank José Henriques (HBio Lda.) and Engineer Ricardo Mendes (Frutalvor-Central Fruteira CRL) for technical assistance on the orchards and storage chambers.

Conflicts of Interest

The authors declare no conflict of interest. The funders had no role in the design of the study; in the collection, analyses or interpretation of the data; in the writing of the manuscript; or in the decision to publish the results.

References

  1. Shlisky, J.; Mandlik, R.; Askari, S.; Abrams, S.; Belizan, J.M.; Bourassa, M.W.; Cormick, G.; Driller-Colangelo, A.; Gomes, F.; Khadilkar, A.; et al. Calcium deficiency worldwide: Prevalence of inadequate intakes and associated health outcomes. Ann. N. Y. Acad. Sci. 2022, 1512, 1–19. [Google Scholar] [CrossRef] [PubMed]
  2. EFSA NDA Panel—European Food Safety Authority. Scientific opinion on dietary reference values for calcium. EFSA J. 2015, 13, 1–82. [Google Scholar] [CrossRef]
  3. IOF—International Osteoporosis Foundation. Facts & Statistics. Available online: https://www.osteoporosis.foundation/facts-statistics (accessed on 9 June 2022).
  4. NIH—National Institutes of Health. Calcium Fact Sheet for Health Professionals. Available online: https://ods.od.nih.gov/factsheets/Calcium-HealthProfessional/ (accessed on 9 June 2022).
  5. Veronese, N.; Barbagallo, M. Magnesium and micro-elements in older persons. Nutrients 2021, 13, 847. [Google Scholar] [CrossRef] [PubMed]
  6. Cormick, G.; Belizán, J.M. Calcium intake and health. Nutrients 2019, 11, 1606. [Google Scholar] [CrossRef]
  7. Ströhle, A.; Hadji, P.; Hahn, A. Calcium and bone health—Goodbye, calcium supplements? Climacteric 2015, 18, 702–714. [Google Scholar] [CrossRef]
  8. Huey, S.L.; Krisher, J.T.; Bhargava, A.; Friesen, V.M.; Konieczynski, E.M.; Mbuya, M.N.N.; Mehta, N.H.; Monterrosa, E.; Nyangaresi, A.M.; Mehta, S. Review of the impact pathways of biofortified foods and food products. Nutrients 2022, 14, 1200. [Google Scholar] [CrossRef]
  9. Garg, M.; Sharma, N.; Sharma, S.; Kapoor, P.; Kumar, A.; Chunduri, V.; Arora, P. Biofortified crops generated by breeding, agronomy, and transgenic approaches are improving lives of millions of people around the world. Front. Nutr. 2018, 5, 12. [Google Scholar] [CrossRef]
  10. Dayod, M.; Tyerman, S.D.; Leigh, R.A.; Gilliham, M. Calcium storage in plants and the implications for calcium biofortification. Protoplasma 2010, 247, 215–231. [Google Scholar] [CrossRef]
  11. D`Imperio, M.; Renna, M.; Cardinali, A.; Buttaro, D.; Serio, F.; Santamaria, P. Calcium biofortification and bioaccessibility in soilless “baby leaf” vegetable production. Food Chem. 2016, 213, 149–156. [Google Scholar] [CrossRef]
  12. Gharibzahedi, S.M.T.; Jafari, S.M. The importance of minerals in human nutrition: Bioavailability, food fortification, processing effects and nanoencapsulation. Trends Food Sci. Tech. 2017, 62, 119–132. [Google Scholar] [CrossRef]
  13. Bloot, A.P.M.; Kalschne, D.L.; Amaral, J.A.S.; Baraldi, I.J.; Canan, C. A review of phytic acid sources, obtention, and applications. Food Rev. Int. 2021, 1–20. [Google Scholar] [CrossRef]
  14. St Joseph’s Healthcare Hamilton—Oxalate in Food. Available online: https://www.stjoes.ca/patients-visitors/patient-education/patient-education-k-o (accessed on 31 May 2022).
  15. Yahia, E.M.; Gardea-Béjar, A.; Ornelas-Paz, J.J.; Maya-Meraz, I.O.; Rodríguez-Roque, M.J.; Rios-Velasco, C.; Ornelas-Paz, J.; Salas-Marina, M. Chapter 4—Preharvest factors affecting postharvest quality. In Postharvest Technology of Perishable Horticultural Commodities; Yahia, E.M., Ed.; Elsevier: Amsterdam, The Netherlands, 2019; pp. 99–128. [Google Scholar]
  16. Sugar, D.; Righetti, T.L.; Sanchez, E.E.; Khemira, H. Management of nitrogen and calcium in pear trees for enhancement of fruit resistance to postharvest decay. HortTechnology 1992, 2, 382–387. [Google Scholar] [CrossRef]
  17. Gąstoł, M.; Domagała-Świątkiewicz, I. Mineral composition of “Conference” pears as affected by different foliar sprays. Pol. J. Environ. Stud. 2009, 18, 739–742. [Google Scholar]
  18. Wójcik, P.; Skorupińska, A.; Filipczak, J. Impacts of preharvest fall sprays of calcium chloride at high rates on quality and “Conference” pear storability. Sci. Hortic. 2014, 168, 51–57. [Google Scholar] [CrossRef]
  19. Wei, S.; Qin, G.; Zhang, H.; Tao, S.; Wu, J.; Wang, S.; Zhang, S. Calcium treatments promote the aroma volatiles emission of pear (Pyrus ussuriensis “Nanguoli”) fruit during post-harvest ripening process. Sci. Hortic. 2017, 215, 102–111. [Google Scholar] [CrossRef]
  20. Wang, Y.; Zhang, X.; Wang, Y.; Yang, S.; Qu, H. The changes of intracellular calcium concentration and distribution in the hard end pear (Pyrus pyrifolia cv. “Whangkeumbae”) fruit. Cell Calcium 2018, 71, 15–23. [Google Scholar] [CrossRef]
  21. Pessoa, C.C.; Lidon, C.F.; Coelho, A.R.F.; Caleiro, J.C.; Marques, A.C.; Luís, I.C.; Kullberg, J.C.; Legoinha, P.; Brito, M.G.; Ramalho, J.C.; et al. Calcium biofortification of Rocha pears, tissues accumulation and physicochemical implications in fresh and heat-treated fruits. Sci. Hortic. 2021, 277, 109834. [Google Scholar] [CrossRef]
  22. Pessoa, C.C.; Lidon, F.C.; Luís, I.C.; Marques, A.C.; Coelho, A.R.F.; Daccak, D.; Ramalho, J.C.; Silva, M.J.; Rodrigues, A.P.; Guerra, M.; et al. Under calcium spraying nutrients accumulation in the initial stages of fruits development is critical in “Rocha” pears. Emir. J. Food Agr. 2021, 33, 868–883. [Google Scholar] [CrossRef]
  23. Li, X.; Li, X.; Wang, T.; Gao, W. Nutritional composition of pear cultivars (Pyrus spp.). In Nutritional Composition of Fruit Cultivars; Simmonds, M.S.J., Preedy, V.R., Eds.; Elsevier: Amsterdam, The Netherlands, 2016; pp. 573–608. [Google Scholar] [CrossRef]
  24. PortFIR—Food Composition Pear. Available online: http://portfir.insa.pt/foodcomp/food?22189 (accessed on 9 June 2022).
  25. Qin, G.; Tao, S.; Zhang, H.; Huang, W.; Wu, J.; Xu, Y.; Zhang, S. Evolution of the aroma volatiles of pear fruits supplemented with fatty acid metabolic precursors. Molecules 2014, 19, 20183–20196. [Google Scholar] [CrossRef]
  26. Pedro, S.I.; Coelho, E.; Peres, F.; Machado, A.; Rodrigues, A.M.; Wessel, D.F.; Coimbra, M.A.; Anjos, O. Physicochemical fingerprint of “Pera Rocha do Oeste”. A PDO pear native from Portugal. Foods 2020, 9, 1209. [Google Scholar] [CrossRef]
  27. ANP—Associação Nacional de Produtores de Pera Rocha. Available online: https://perarocha.pt/pera-rocha/ (accessed on 30 May 2022).
  28. Yahia, E.M. Chapter 3—Classification of horticultural commodities. In Postharvest Technology of Perishable Horticultural Commodities; Yahia, E.M., Ed.; Elsevier: Amsterdam, The Netherlands, 2019; pp. 71–97. [Google Scholar]
  29. Luís, I.C.; Lidon, F.C.; Pessoa, C.C.; Marques, A.C.; Coelho, A.R.F.; Simões, M.; Patanita, M.; Dôres, J.; Ramalho, J.C.; Silva, M.M.; et al. Zinc enrichment in two contrasting genotypes of Triticum aestivum L. grains: Interactions between edaphic conditions and foliar fertilizers. Plants 2021, 10, 204. [Google Scholar] [CrossRef] [PubMed]
  30. Medlicott, A.; Thompson, A. Analysis of sugar and organic acids in ripening mango fruits (Mangifera indica L. var Keitt) by high performance liquid chromatography. J. Sci. Food Agr. 1985, 36, 561–566. [Google Scholar] [CrossRef]
  31. Vidigal, P.; Duarte, B.; Cavaco, A.R.; Caçador, I.; Figueiredo, A.; Matos, A.R.; Viegas, W.; Monteiro, F. Preliminary diversity assessment of an undervalued tropical bean (Lablab purpureus (L.) Sweet) through fatty acid profiling. Plant Physiol. Bioch. 2018, 132, 508–514. [Google Scholar] [CrossRef] [PubMed]
  32. Mazliak, P. Plant membrane lipids: Changes and alterations during aging and senescence. In Post-Harvest Physiology and Crop Preservation; Lieberman, M., Ed.; Springer: Boston, MA, USA, 1983; Volume 46, pp. 123–140. [Google Scholar] [CrossRef]
  33. Raese, J.T.; Drake, S.R. Effect of calcium sprays, time of harvest, cold storage, and ripeness on fruit quality of ‘Anjou’ pears. J. Plant Nutr. 2000, 23, 843–853. [Google Scholar] [CrossRef]
  34. Reboredo, F.H.; Sánchez, C.; Santos, M.; Ramos, P.; Rodrigues, C.; Ribeiro, V.; Pessoa, M.F.; Lidon, F.C. Calcium biofortification of apples: Implications on fruit quality parameters. In Proceedings of the COST Action Project FA 0905 Mineral-Improved Crop Production for Healthy Food and Feed, Final Conference Agronomic, Molecular Genetics and Human Nutrition Approaches for Improving the Nutricional Quality and Safety of Food Crops, Ela Quality Resort, Antalya-Belek, Turkey, 17–19 March 2014; pp. 52–53. [Google Scholar]
  35. Domagała-Świątkiewicz, I.; Błaszczyk, J. Effect of calcium nitrate spraying on mineral contents and storability of ‘Elise’ apples. Pol. J. Environ. Stud. 2009, 18, 971–976. [Google Scholar]
  36. Flis, S. Calcium: Improved plant health and nutrition through 4R management. Crops Soils 2019, 52, 28–30. [Google Scholar] [CrossRef]
  37. Almeida, D. Managing calcium in the soil-plant-fruit system. In Crops: Growth, Quality and Biotechnology; Dris, R., Ed.; WFL Publisher: Helsinki, Finland, 2005; pp. 448–459. [Google Scholar]
  38. Soares, J.; Silva, A.; Marques, H. Capítulo IV—Nutrição da Pereira Rocha; da Pera Rocha, O.L., de Produtores, A.N., de Pera, R., Eds.; ANP: Cadaval, Portugal, 2003; Volume 2, pp. 129–171. [Google Scholar]
  39. Tokala, V.Y.; Mahajan, B.V.C. Calcium: An indispensable element effecting postharvest life of fruits and vegetables. In Emerging Postharvest Treatment of Fruits and Vegetables, 1st ed.; Barman, K., Sharma, S., Siddiqui, M.W., Eds.; Apple Academic Press: New York, NY, USA, 2018; pp. 59–83. [Google Scholar] [CrossRef]
  40. PortFIR—Food Composition Pear, Dehydrated. Available online: http://portfir.insa.pt/foodcomp/food?22613 (accessed on 23 June 2022).
  41. Mendes, R.D.B. Pools de Nutrients em Pomares e sua Relação Com a Incidência de Acastanhamentos Internos em Pera Rocha. Master’s Thesis, School of Agriculture, Technical University of Lisbon, Lisbon, Portugal, 2017. Available online: http://hdl.handle.net/10400.5/14841 (accessed on 31 May 2022).
  42. Saquet, A.A.; Streif, J.; Almeida, D.P.F. Mineral composition and distribution within ‘Rocha’ pear in relation to internal storage disorders. Postharvest Biol. Technol. 2019, 158, 111002. [Google Scholar] [CrossRef]
  43. Pagani, A.; Sawyer, J.E.; Mallarino, A. Site-specific nutrient management: For nutrient management planning to improve crop production, environmental quality, and economic return. Ext. Outreach Publ. 2013, 116. Available online: http://lib.dr.iastate.edu/extension_pubs/116 (accessed on 31 May 2022).
  44. Atkinson, R.G.; Brummell, D.A.; Burdon, J.N.; Patterson, K.J.; Schaffer, R.J. Chapter 11—Fruit growth, ripening and post-harvest physiology. In Plants in Action, 2nd ed.; Brummel, D.A., Ed.; Australian Society of Plant Scientists: Melbourne, Australia, 2017; Available online: http://plantsinaction.science.uq.edu.au (accessed on 31 May 2022).
  45. Fageria, V.D. Nutrient interactions in crop plants. J. Plant Nutr. 2001, 24, 1269–1290. [Google Scholar] [CrossRef]
  46. Kadir, S.A. Fruit quality at harvest of “Jonathan” apple treated with foliarly-applied calcium chloride. J. Plant Nutr. 2005, 27, 1991–2006. [Google Scholar] [CrossRef]
  47. Lidon, F.C.; Ribeiro, V.; Reboredo, F.H.; Pessoa, M.F.; Santos, M.; Ramos, P.; Sánchez, C. Calcium biofortification of apples- Interaction with macronutrients. In Proceedings of the COST Action Project FA 0905 Mineral-Improved Crop Production for Healthy Food and Feed, Final Conference Agronomic, Molecular Genetics and Human Nutrition Approaches for Improving the Nutricional Quality and Safety of Food Crops, Ela Quality Resort, Antalya-Belek, Turkey, 17–19 March 2014; pp. 102–103. [Google Scholar]
  48. Coelho, A.R.F.; Ramalho, J.C.; Lidon, F.C.; Marques, A.C.; Daccak, D.; Pessoa, C.C.; Luís, I.C.; Guerra, M.; Leitão, R.G.; Semedo, J.M.N.; et al. Foliar spraying of Solanum tuberosum L. with CaCl2 and Ca(NO3)2: Interactions with nutrients accumulation in tubers. Plants 2022, 11, 1725. [Google Scholar] [CrossRef]
  49. Taiz, L.; Zeiger, E. Plant Physiology, 3rd ed.; Sinauer Associates: Sunderland, MA, USA, 2002; p. 623. [Google Scholar]
  50. Daccak, D.; Lidon, F.C.; Pessoa, C.C.; Luís, I.C.; Coelho, A.R.F.; Marques, A.C.; Ramalho, J.C.; Silva, M.J.; Rodrigues, A.P.; Guerra, M.; et al. Enrichment of grapes with zinc-efficiency of foliar fertilization with ZnSO4 and ZnO and implications on winemaking. Plants 2022, 11, 1399. [Google Scholar] [CrossRef] [PubMed]
  51. Coelho, A.R.F.; Lidon, F.C.; Pessoa, C.C.; Marques, A.C.; Luís, I.C.; Caleiro, J.C.; Simões, M.; Kullberg, J.; Legoinha, P.; Brito, G.; et al. Can foliar pulverization with CaCl2 and Ca(NO3)2 trigger Ca enrichment in Solanum Tuberosum L. tubers? Plants 2021, 10, 245. [Google Scholar] [CrossRef] [PubMed]
  52. Lidon, F.C.; Ribeiro, V.; Reboredo, F.H.; Pessoa, M.F.; Santos, M.; Ramos, P.; Sánchez, C. Calcium biofortification of apples- Interaction with micronutrients. In Proceedings of the COST Action Project FA 0905 Mineral-Improved Crop Production for Healthy Food and Feed, Final Conference Agronomic, Molecular Genetics and Human Nutrition Approaches for Improving the Nutricional Quality and Safety of Food Crops, Ela Quality Resort, Antalya-Belek, Turkey, 17–19 March 2014; pp. 104–105. [Google Scholar]
  53. Akšić, M.F.; Tosti, T.; Sredojević, M.; Milivojević, J.; Meland, M.; Natić, M. Comparison of sugar profile between leaves and fruits of blueberry and strawberry cultivars grown in organic and integrated production system. Plants 2019, 8, 205. [Google Scholar] [CrossRef] [PubMed]
  54. Magwaza, L.S.; Opara, U.L. Analytical methods for determination of sugar and sweetness of horticultural products-A review. Sci. Hortic. 2015, 184, 179–192. [Google Scholar] [CrossRef]
  55. Yahia, E.M.; Carrilo-López, A.; Bello-Perez, L.A. Chapter 9—Carbohydrates. In Postharvest Physiology and Biochemistry of Fruits and Vegetables; Yahia, E.M., Ed.; Elsevier: Amsterdam, The Netherlands, 2019; pp. 175–205. [Google Scholar] [CrossRef]
  56. Hudina, M.; Štampar, F. Sugars and organic acids contents of European (Pyrus communis L.) and Asian (Pyrus serotina REHD.) pear cultivars. Acta Alimentar. Hung 2000, 29, 217–230. [Google Scholar] [CrossRef]
  57. Siddiqui, M.W. Preharvest Modulation of Postharvest Fruit and Vegetable Quality, 1st ed.; AcademicPress: San Diego, CA, USA, 2018; pp. 1–516. [Google Scholar]
  58. Hudina, M.; Stampar, F. Free sugar and sorbitol content in pear (Pyrus communis L.) CV. Williams during fruit development using different treatments. Acta Hortic. 2000, 514, 269–274. [Google Scholar] [CrossRef]
  59. Domínguez-Avila, J.A.; González-Aguilar, G.A. Chapter 13- Lipids. In Postharvest Physiology and Biochemistry of Fruits and Vegetables; Yahia, E.M., Ed.; Elsevier: Amsterdam, The Netherlands, 2019; pp. 273–292. [Google Scholar] [CrossRef]
  60. Hussain, S.; Masud, T.; Bano, R.; Wang, H.; Ali, S.; Ali, A. Comparative study of two pear (Pyrus communis L.) cultivars in terms of nutritional composition. Food Sci. Qual. Manag. 2015, 36, 48–54. [Google Scholar]
  61. Duroňová, K.; Márová, I.; Čertík, M.; Obruča, S. Changes in lipid composition of apple surface layer during long-term storage in controlled atmosphere. Chem. Pap. 2012, 66, 940–948. [Google Scholar] [CrossRef]
  62. Brizzolara, S.; Manganaris, G.A.; Fotopoulos, V.; Watkins, C.B.; Tonutti, P. Primary metabolism in fresh fruits during storage. Front. Plant Sci. 2020, 11, 80. [Google Scholar] [CrossRef]
  63. Deng, X. Mechanisms of Calcium-Induced Firmness in Fruits, Vegetables, and Mushrooms. Master’s Thesis, University of Tennessee, Knoxville, TN, USA, 2008. Available online: https://trace.tennessee.edu/utk_gradthes/3647/ (accessed on 2 June 2022).
  64. Poovaiah, B.W.; Glenn, G.M.; Reddy, A.S.N. Calcium and fruit softening: Physiology and biochemistry. In Horticultural Reviews; Janick, J., Ed.; Timber Press: Portland, OR, USA, 1998; Volume 10, pp. 107–152. [Google Scholar] [CrossRef]
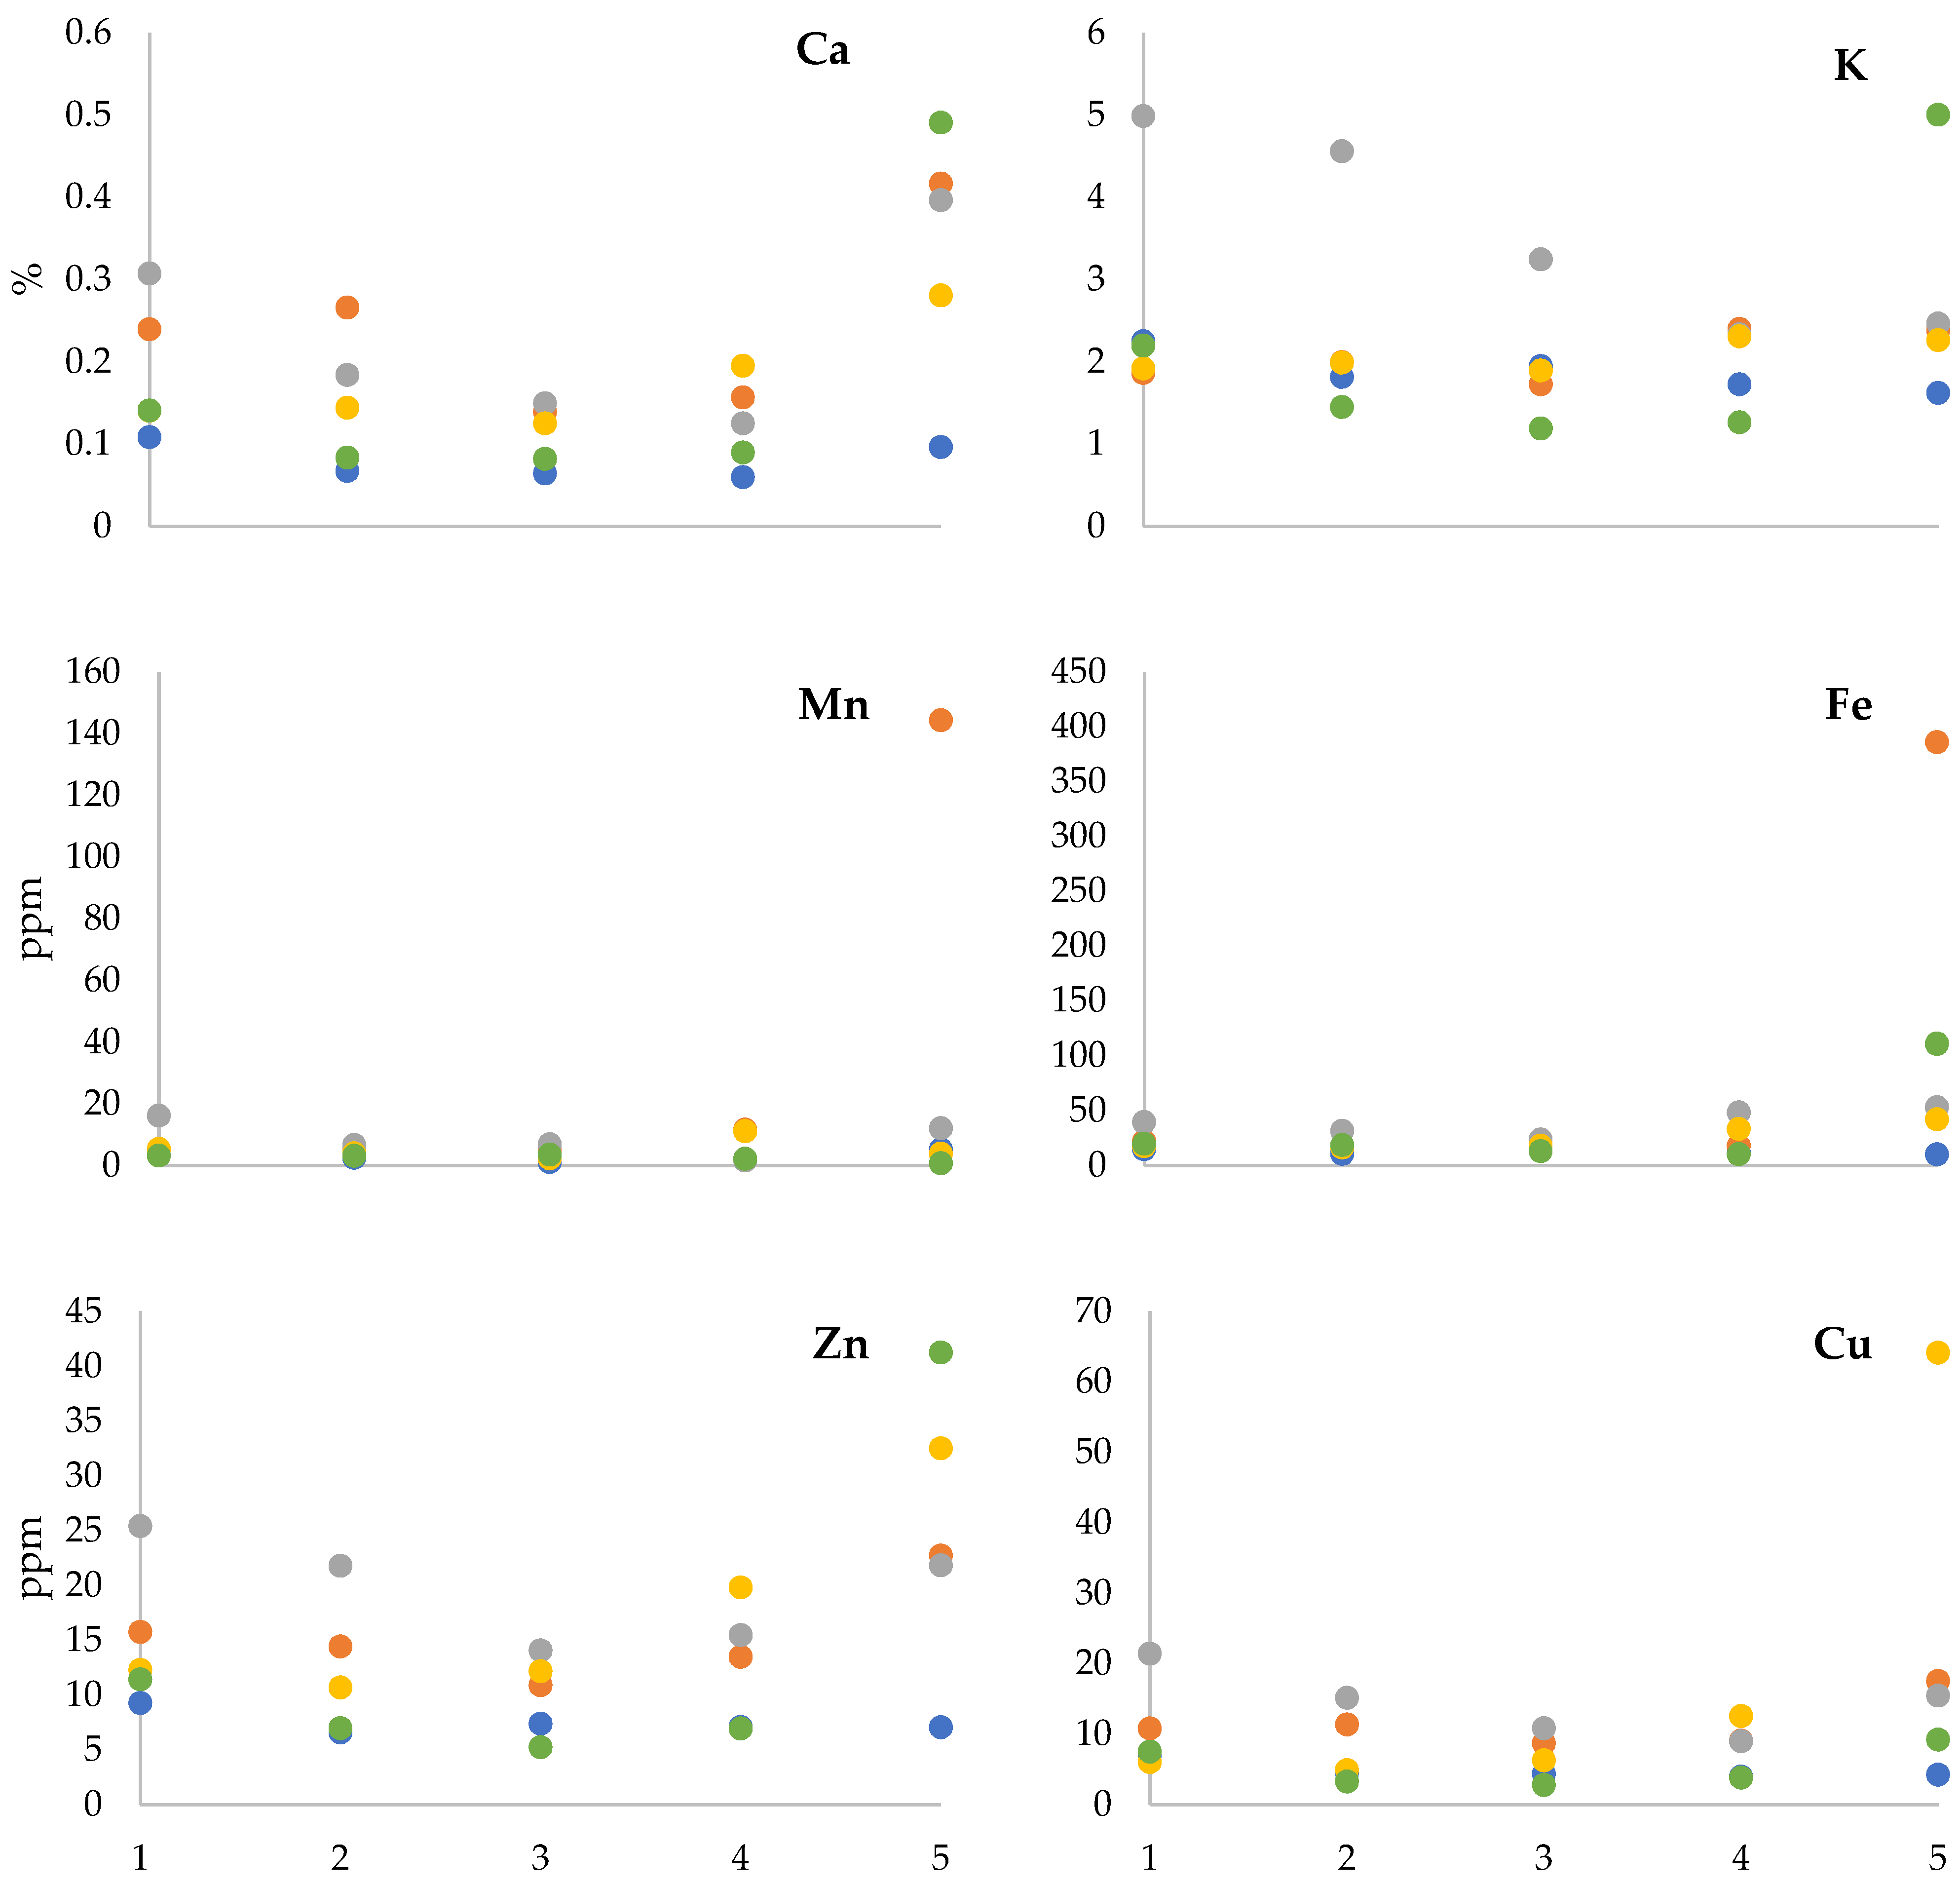
Figure 1. Example of a sliced sample of Rocha pear fruits with a stainless-steel blade. Green lines delineate different zones for minerals assessment (from center to epidermis, zones 1 to 5, respectively).
Sci 04 00035 g001
Figure 2. Distribution of Ca, K, Mn, Fe, Zn and Cu of Rocha pear fruits by region (from center to epidermis, zone 1 to 5, respectively), at harvest. Treatments Ctr, T0.1, T0.6, T0.8 and T1.6 (corresponding to the control and leaves spraying with 0.1 and 0.6 kg·ha−1 Ca(NO3)2 and 0.8 and 1.6 kg·ha−1 CaCl2, respectively), are represented by colors blue, orange, grey, yellow and green, respectively. Standard errors were lower than 1%.
Sci 04 00035 g002
Table 1. Average ± S.E. of Ca, K, Mn, Fe, Zn and Cu from Rocha pear fruits by region (from center to epidermis, zone 1 to 5, respectively), after 5 months of storage. Treatments Ctr, T0.1, T0.6, T0.8 and T1.6 correspond to the control and initial foliar spraying with 0.1 and 0.6 kg·ha−1 Ca(NO3)2 and 0.8 and 1.6 kg·ha−1 CaCl2, respectively. Letters a, b and c represent significant differences among regions for each treatment.
MineralsRegions5 Months StorageRate (5 Months Storage/Harvest)
CtrT0.1T0.6T0.8T1.6CtrT0.1T0.6T0.8T1.6
Ca (%)10.100a ± 0.0050.374b ± 0.0000.460ab ± 0.0000.197ab ± 0.0000.478ab ± 0.0000.91.61.51.43.4
20.060a ± 0.0030.284b ± 0.0000.209bc ± 0.0000.188ab ± 0.0000.304b ± 0.0000.91.11.11.33.7
30.052a ± 0.0030.248b ± 0.0000.245bc ± 0.0000.205ab ± 0.0000.312b ± 0.0000.81.81.61.63.8
40.049a ± 0.0020.214b ± 0.0000.131c ± 0.0000.115b ± 0.0000.228b ± 0.0000.81.41.10.62.5
50.327a ± 0.0161.135a ± 0.0010.985a ± 0.0010.384a ± 0.0001.670a ± 0.0023.42.72.51.43.4
K (%)15.36a ± 0.014.78a ± 0.016.71a ± 0.013.99a ± 0.005.15a ± 0.012.42.61.32.12.3
25.53a ± 0.014.91a ± 0.014.96ab ± 0.013.58a ± 0.004.57a ± 0.013.02.51.11.83.2
32.76ab ± 0.003.55a ± 0.005.31ab ± 0.014.17a ± 0.014.34a ± 0.011.42.11.62.23.7
41.66b ± 0.002.96a ± 0.002.60b ± 0.002.52a ± 0.003.17a ± 0.001.01.21.11.12.5
54.21a ± 0.014.11a ± 0.015.21ab ± 0.014.29a ± 0.015.14a ± 0.002.61.72.11.91.0
Mn (ppm)118.3ab ± 0.015.5b ± 0.015.2b ± 0.09.5b ± 0.014.7b ± 0.05.64.90.91.84.6
211.1b ± 0.016.9b ± 0.012.8b ± 0.014.6b ± 0.011.8b ± 0.04.53.41.93.83.8
38.5b ± 0.010.3b ± 0.019.1b ± 0.011.7b ± 0.010.7b ± 0.07.61.92.85.13.0
48.2b ± 0.012.0b ± 0.010.1b ± 0.09.9b ± 0.010.0b ± 0.05.11.06.50.94.7
544.5a ± 0.049.5a ± 0.066.3a ± 0.0110.2a ± 0.0122.1a ± 0.08.50.35.528.6182.1
Fe (ppm)137.9b ± 0.035.0b ± 0.046.3ab ± 0.043.0b ± 0.028.3b ± 0.02.61.61.22.41.4
232.4b ± 0.030.3b ± 0.025.5b ± 0.055.7ab ± 0.021.3b ± 0.03.11.80.83.41.1
317.4b ± 0.022.8b ± 0.038.2b ± 0.037.8b ± 0.030.5b ± 0.01.31.61.62.12.3
418.8b ± 0.023.3b ± 0.023.5b ± 0.022.4b ± 0.024.7b ± 0.01.61.30.50.72.4
5112.2a ± 0.0274.2a ± 0.0111.4a ± 0.0124.8a ± 0.0151.6a ± 0.011.00.72.13.01.4
Zn (ppm)126.9ab ± 0.024.8ab ± 0.026.1ab ± 0.027.6ab ± 0.015.6b ± 0.02.91.61.02.21.4
217.7ab ± 0.022.3ab ± 0.011.9b ± 0.024.8ab ± 0.014.1b ± 0.02.71.50.52.32.0
311.4b ± 0.014.9b ± 0.020.0ab ± 0.028.2ab ± 0.016.5b ± 0.01.51.41.42.33.1
411.2b ± 0.019.9ab ± 0.014.7b ± 0.022.8b ± 0.015.4b ± 0.01.61.51.01.22.2
542.2a ± 0.045.2a ± 0.042.8a ± 0.059.3a ± 0.059.3a ± 0.06.02.02.01.81.4
Cu (ppm)123.6a ± 0.022.3a ± 0.020.3ab ± 0.018.4a ± 0.017.9a ± 0.03.32.10.93.02.4
227.2a ± 0.023.4a ± 0.012.7ab ± 0.016.3a ± 0.021.4a ± 0.06.12.10.83.36.5
313.4ab ± 0.014.0a ± 0.017.7ab ± 0.021.4a ± 0.016.8a ± 0.03.11.61.63.46.0
47.4b ± 0.012.3a ± 0.010.7b ± 0.016.4a ± 0.013.0a ± 0.01.91.41.21.33.4
525.9a ± 0.024.7a ± 0.027.8a ± 0.032.2a ± 0.027.3a ± 0.06.11.41.80.53.0
Table 2. Average ± S.E. of sugar content (sucrose, glucose, fructose, sorbitol and total) from Rocha pear from September (harvest) and March (5 months of storage). Treatments Ctr, T0.1, T0.6, T0.8 and T1.6 correspond to the control and initial foliar spraying with 0.1 and 0.6 kg·ha−1 Ca(NO3)2 and 0.8 and 1.6 kg·ha−1 CaCl2, respectively. Letters a, b and c represent significant differences among treatments for each date, while A and B represent significant differences between harvest and 5 month storage for each treatment.
TreatmentsSucroseGlucoseFructoseSorbitolTotal
Harvest (g/100 g FW)
Ctr2.59aA ± 0.401.67aA ± 0.376.63aA ± 1.102.23aA ± 0.3313.12aA ± 0.95
T0.12.42aA ± 0.271.20aB ± 0.158.44aB ± 0.922.43aB ± 0.2914.49aB ± 1.62
T0.63.38aA ± 0.441.46aA ± 0.199.95aA ± 1.053.09aA ± 0.3317.88aA ± 1.98
T0.82.64aA ± 0.301.51aA ± 0.0610.66aA ± 0.623.32aA ± 0.1918.12aA ± 0.85
T1.62.60aA ± 0.651.32aA ± 0.217.33aA ± 1.482.20aA ± 0.4413.45aA ± 2.47
5 Months storage (g/100 g FW)
Ctr0.44cB ± 0.051.04bA ± 0.056.51bA ± 0.691.71bA ± 0.209.70cA ± 0.97
T0.11.81aA ± 0.143.02aA ± 0.0818.14aA ± 0.295.07aA ± 0.0128.04aA ± 0.20
T0.61.21bB ± 0.111.35bA ± 0.198.34bA ± 1.352.42abA ± 0.3213.32bcA ± 1.92
T0.80.75bcB ± 0.171.23bA ± 0.227.44bA ± 1.322.09bB ± 0.3711.51bcB ± 1.83
T1.60.92bcA ± 0.041.51bA ± 0.269.59bA ± 1.945.29aA ± 1.3017.31bA ± 0.88
Ratio (5 Months storage/Harvest)
Ctr0.170.620.980.770.74
T0.10.752.522.152.081.94
T0.60.360.920.840.780.74
T0.80.280.810.700.630.63
T1.60.351.141.312.401.29
Table 3. Average ± S.E. of total fatty acid content (TFA), fatty acids profiles (relative abundance, mol %) and double bound index (DBI) of lipids from Rocha pear fruits at harvest and after 5 months of storage. Treatments Ctr, T0.1, T0.6, T0.8 and T1.6 correspond to the control and foliar spraying with 0.1 and 0.6 kg·ha−1 Ca(NO3)2 and 0.8 and 1.6 kg·ha−1 CaCl2, respectively. Letters a, b and c represent significant differences among treatments for each date, while A and B represent significant differences between harvest and 5 months of storage for each treatment.
TreatmentTFA<C16:0C16:0C18:0C18:1C18:2C18:3DBI
g/100 g FWHarvest (mol %)
Ctr0.67aA ± 0.090.32bcA ± 0.0813.56abB ± 1.545.68aA ± 0.8024.68aA ± 0.7749.44aA ± 2.496.32bB ± 0.317.62abA ± 0.88
T0.10.71aA ± 0.050.24cB ± 0.039.34bB ± 0.696.35aA ± 0.6426.10aA ± 0.8150.56aA ± 0.887.41bB ± 0.239.50aA ± 0.32
T0.60.68aA ± 0.100.44abcA ± 0.0411.50abB ± 2.126.78aA ± 1.0326.91aA ± 1.0849.00aA ± 1.405.38bB ± 0.328.05abA ± 1.12
T0.80.51aA ± 0.020.64aA ± 0.0917.65aB ± 0.665.57aA ± 0.4817.85bA ± 0.9650.08aA ± 1.088.21abA ± 1.076.00bA ± 0.29
T1.60.51aA ± 0.060.59abA ± 0.0613.93abB ± 1.765.19aA ± 0.7117.17bA ± 0.6152.01aB ± 1.3211.11aA ± 1.318.09abA ± 0.87
g/100 g FW5 Months storage (mol%)
Ctr0.40aB ± 0.010.47aA ± 0.0619.71aA ± 1.562.84aB ± 0.223.22aB ± 0.1151.18bA ± 1.8022.57aA ± 3.137.72aA ± 0.84
T0.10.35aB ± 0.020.77aA ± 0.0922.73aA ± 0.423.02aB ± 0.242.99aB ± 0.4849.66bA ± 2.4720.84aA ± 1.906.30aB ± 0.18
T0.60.38aB ± 0.050.77aA ± 0.1622.47aA ± 0.802.59aB ± 0.403.10aB ± 0.3549.41bA ± 1.0221.66aA ± 1.036.53aA ± 0.30
T0.80.38aB ± 0.030.60aA ± 0.0421.29aA ± 0.522.94aB ± 0.322.09aB ± 0.1858.73abA ± 3.7014.34abA ± 3.326.60aA ± 0.25
T1.60.34aB ± 0.020.73aA ± 0.1720.39aA ± 1.523.67aA ± 0.582.33aB ± 0.1264.84aA ± 1.888.03bA ± 0.466.56aA ± 0.79
Ratio (5 Months storage(mol%)/Harvest(mol%))
Ctr0.601.471.450.500.131.043.571.01
T0.10.493.212.430.480.110.982.810.66
T0.60.561.751.950.380.121.014.030.81
T0.80.750.941.210.530.121.171.751.10
T1.60.671.241.460.710.141.250.720.81
Publisher’s Note: MDPI stays neutral with regard to jurisdictional claims in published maps and institutional affiliations.

